Prometheus and Grafana Dashboard on EKS Cluster using Helm Chart.

This blog explains how you can set up Prometheus and Grafana in Amazon EKS.
Kubernetes abstracts a lot of functionalities under the hood. Effective monitoring of such a dynamic system requires tools with advanced capabilities. Prometheus is one such application.
Prometheus is an open-source automated monitoring and alerting system. It has become a widely accepted tool for monitoring highly dynamic container environments such as Kubernetes and Docker Swarm. It can collect metrics from various sources, including containers, servers, and applications, and store them in a time-series database. Prometheus provides a flexible query language, called PromQL, that allows you to retrieve and analyze data. It also includes a web interface and an API for interacting with the data.
Grafana is a multi-platform that gets data from a data source such as Prometheus and transforms it into visualizations charts. We can create our own dashboards or use the existing ones provided by Grafana. We can personalize the dashboards as per our requirements.
Helm is the package manager for Kubernetes. Helm Charts help you define, install, and upgrade even the most complex Kubernetes application. Charts are easy to create, version, share, and publish — so start using Helm and stop the copy-and-paste.
This article will teach you how to integrate Prometheus and Grafana on Kubernetes using Helm.
Setup an AWS EC2 Instance
Login to an AWS account using a user with admin privileges and ensure your region is set to us-east-1 N. Virginia.
Move to the EC2 console. Click Launch Instance.
For name use Main-Server
Select AMIs as Ubuntu and select Instance Type as t2.medium. Create new Key Pair and Create a new Security Group with traffic allowed from ssh, http and https.

Click on launch Instance and once EC2 Instance started, connect to it with EC2 Instance Connect.
Install AWS CLI and Configure
Now we need to set up the AWS CLI on the EC2 machine so that we can use eksctl in the later stages
Let us get the installation done for AWS CLI 2.
Linux x86(64-bit) If you are using Linux x86(64-bit) operating system:
curl "https://awscli.amazonaws.com/awscli-exe-linux-x86_64.zip" -o "awscliv2.zip"
sudo apt install unzip
unzip awscliv2.zip
sudo ./aws/install
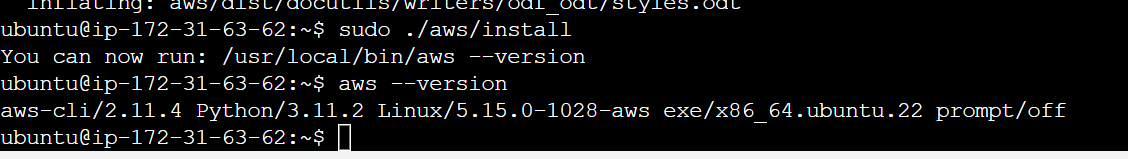
Okay now after installing the AWS CLI, let's configure the AWS CLI so that it can authenticate and communicate with the AWS environment.

Install and Setup Kubectl
Moving forward now we need to set up the kubectl also onto the EC2 instance.
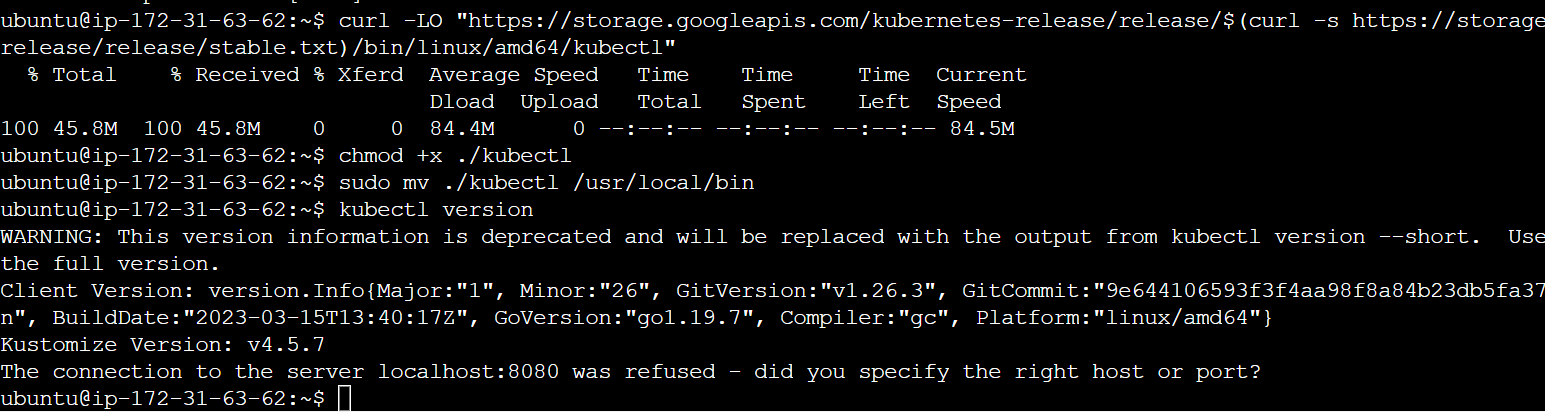
curl -LO "https://storage.googleapis.com/kubernetes-release/release/$(curl -s https://storage.googleapis.com/kubernetes-release/release/stable.txt)/bin/linux/amd64/kubectl"
chmod +x ./kubectl
sudo mv ./kubectl /usr/local/bin
kubectl version
Install and Setup eksctl
Download and extract the latest release of eksctl with the following command.
curl --silent --location "https://github.com/weaveworks/eksctl/releases/latest/download/eksctl_$(uname -s)_amd64.tar.gz" | tar xz -C /tmp
Move the extracted binary to /usr/local/bin.
sudo mv /tmp/eksctl /usr/local/bin
Test that your installation was successful with the following command.
eksctl version

Install Helm chart
The next tool we need is Helm Chart. Helm is a package manager for Kubernetes, an open-source container orchestration platform. Helm helps you manage Kubernetes applications by making it easy to install, update, and delete them.
Install Helm Chart - Use the following script to install the helm chart -
$ curl -fsSL -o get_helm.sh https://raw.githubusercontent.com/helm/helm/main/scripts/get-helm-3
$ chmod 700 get_helm.sh
$ ./get_helm.sh
Verify Helm Chart installation


This way we install all AWS CLI, kubectl, eksctl and Helm.

Creating an Amazon EKS cluster using eksctl
Now in this step, we are going to create Amazon EKS cluster using eksctl
You need the following in order to run the eksctl command
Name of the cluster : --eks4
Version of Kubernetes : --version 1.24
Region : --region us-east-1
Nodegroup name/worker nodes : --nodegroup-name worker-nodes
Node Type : --nodegroup-type t2.large
Number of nodes: --nodes 2
Minimum Number of nodes: --nodes-min 2
Maximum Number of nodes: --nodes-max 3
Here is the eksctl command -
eksctl create cluster --name eks2 --version 1.24 --region us-east-1 --nodegroup-name worker-nodes --node-type t2.large --nodes 2 --nodes-min 2 --nodes-max 3


It took me 20 minutes to complete this EKS cluster. If you get any error for not having sufficient data for mentioned availability zone then try it again.
aws eks update-kubeconfig --name eks4
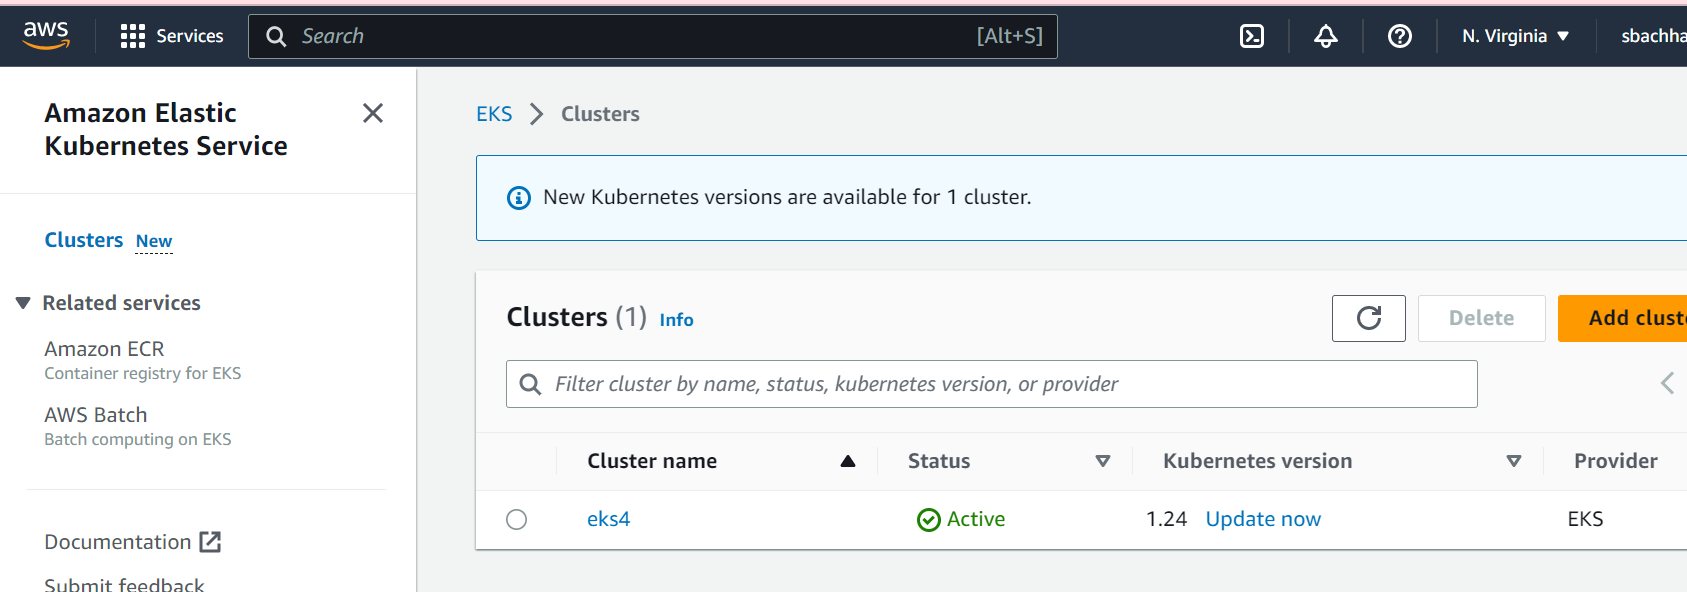
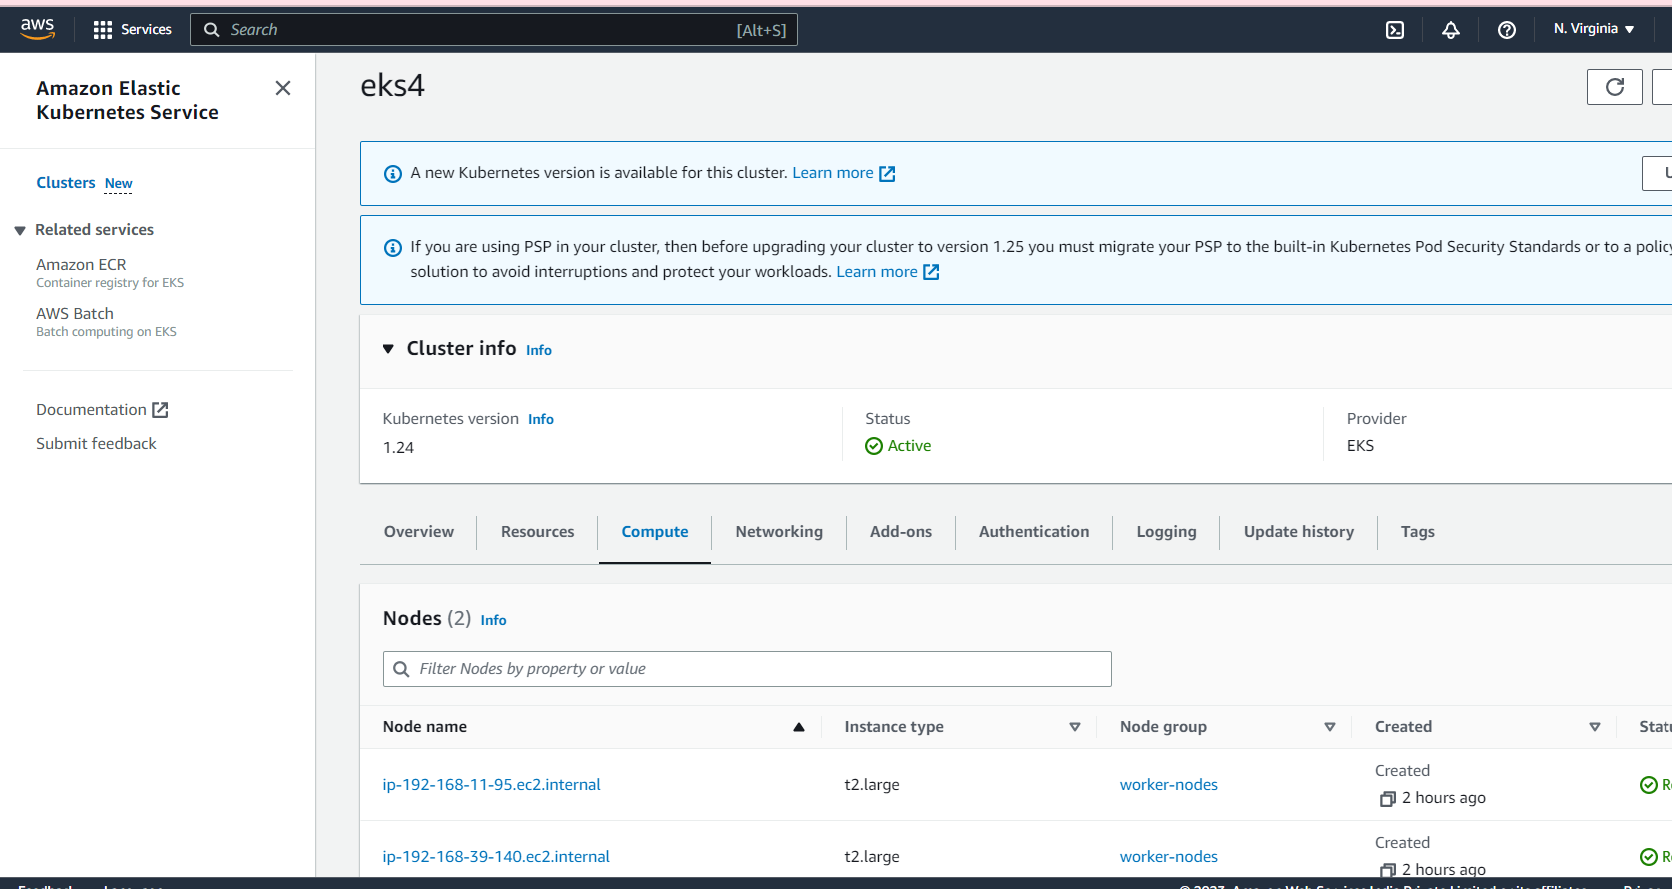
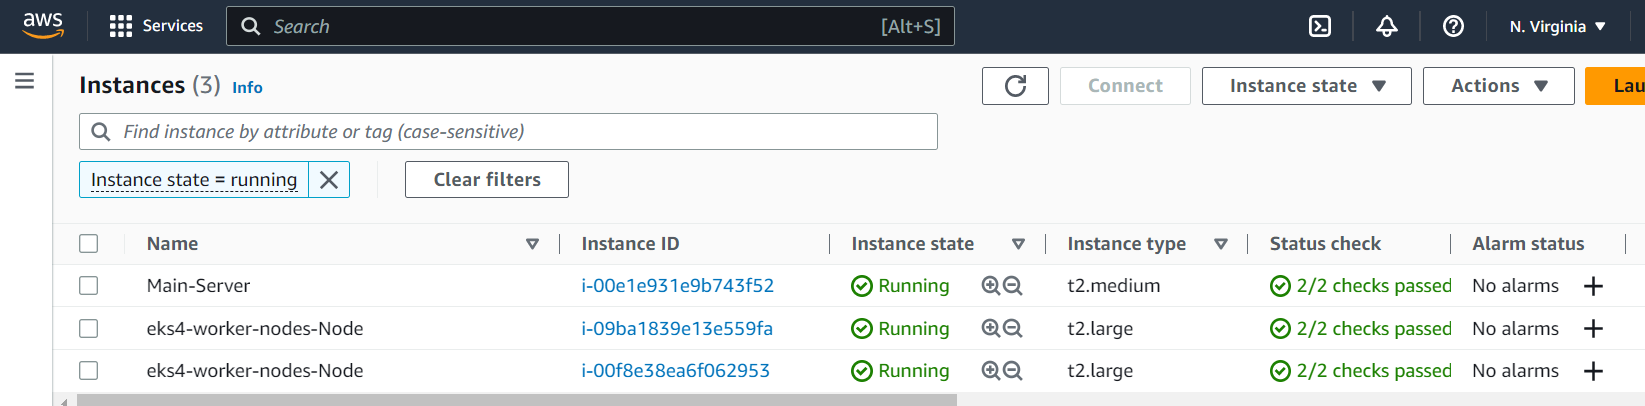
Verify the EKS Kubernetes cluster on AWS Console.
You can go back to your AWS dashboard and look for Elastic Kubernetes Service -> Clusters

Installing the Kubernetes Metrics Server
Alright the next step would be to install the Kubernetes Metrics server onto the Kubernetes cluster so that Prometheus can collect the performance metrics of Kubernetes.
Deploy the Metrics Server with the following command:
kubectl apply -f https://github.com/kubernetes-sigs/metrics-server/releases/latest/download/components.yaml

Verify that the metrics-server deployment is running the desired number of pods with the following command.
kubectl get deployment metrics-server -n kube-system

Install Prometheus
Now install the Prometheus using the helm chart.
Add Prometheus helm chart repository
helm repo add prometheus-community https://prometheus-community.github.io/helm-charts
Update the helm chart repository
helm repo update
helm repo list
Create prometheus namespace
kubectl create namespace prometheus

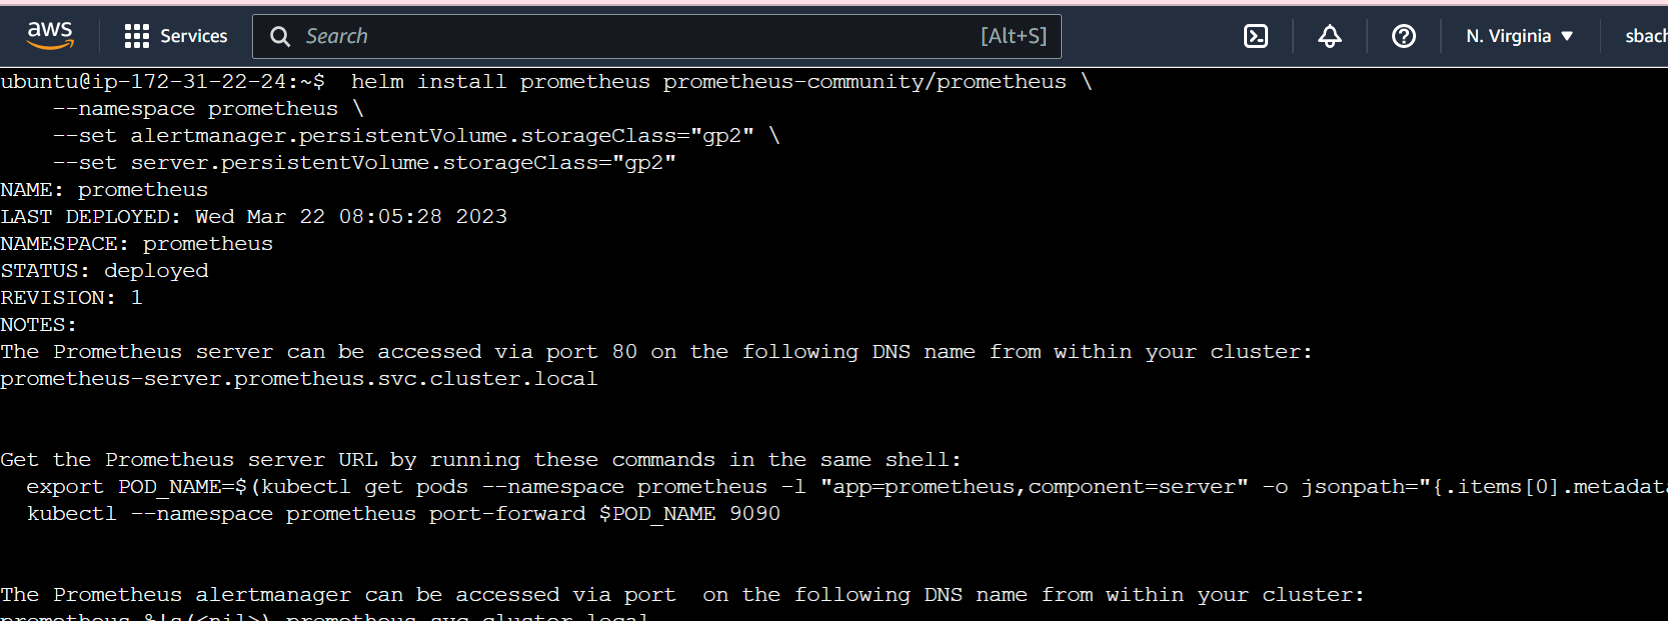
Install Prometheus
 helm install prometheus prometheus-community/prometheus \
    --namespace prometheus \
    --set alertmanager.persistentVolume.storageClass="gp2" \
    --set server.persistentVolume.storageClass="gp2"
Create IAM OIDC Provider
Your cluster has an OpenID Connect (OIDC) issuer URL associated with it. To use AWS Identity and Access Management (IAM) roles for service accounts, an IAM OIDC provider must exist for your cluster's OIDC issuer URL.
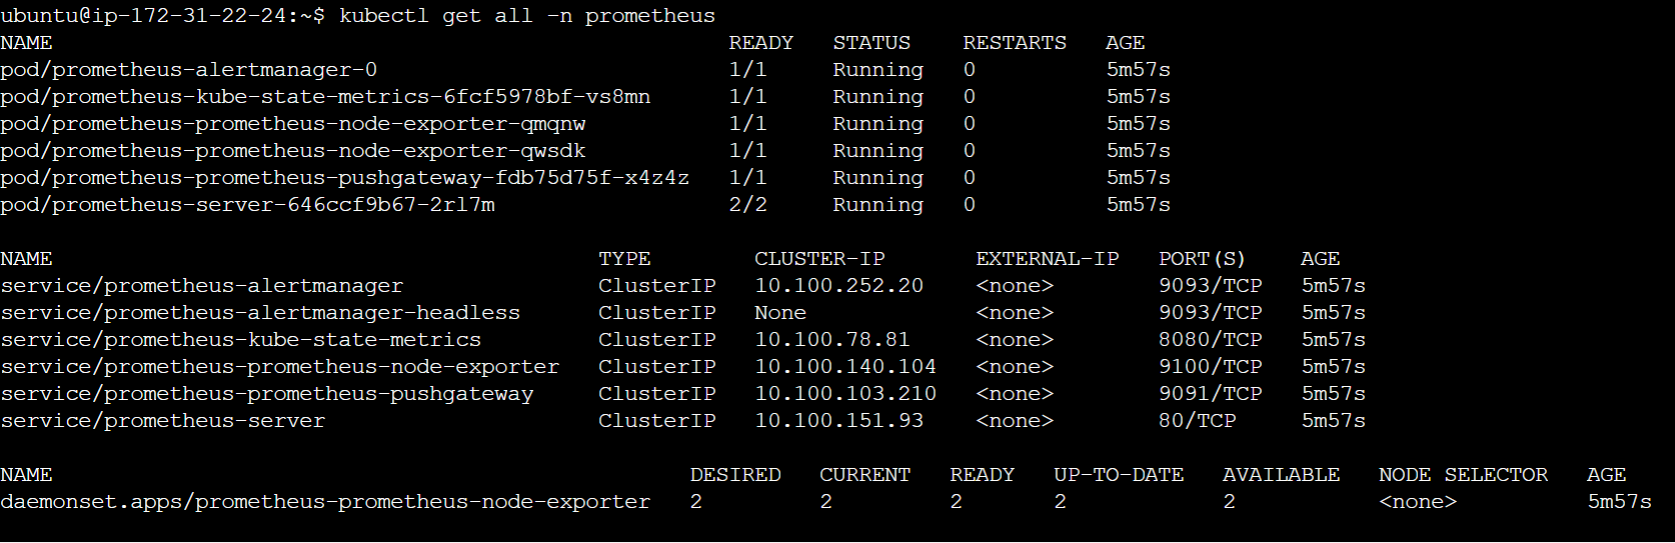
When I run kubectl get all -n -prometheus.
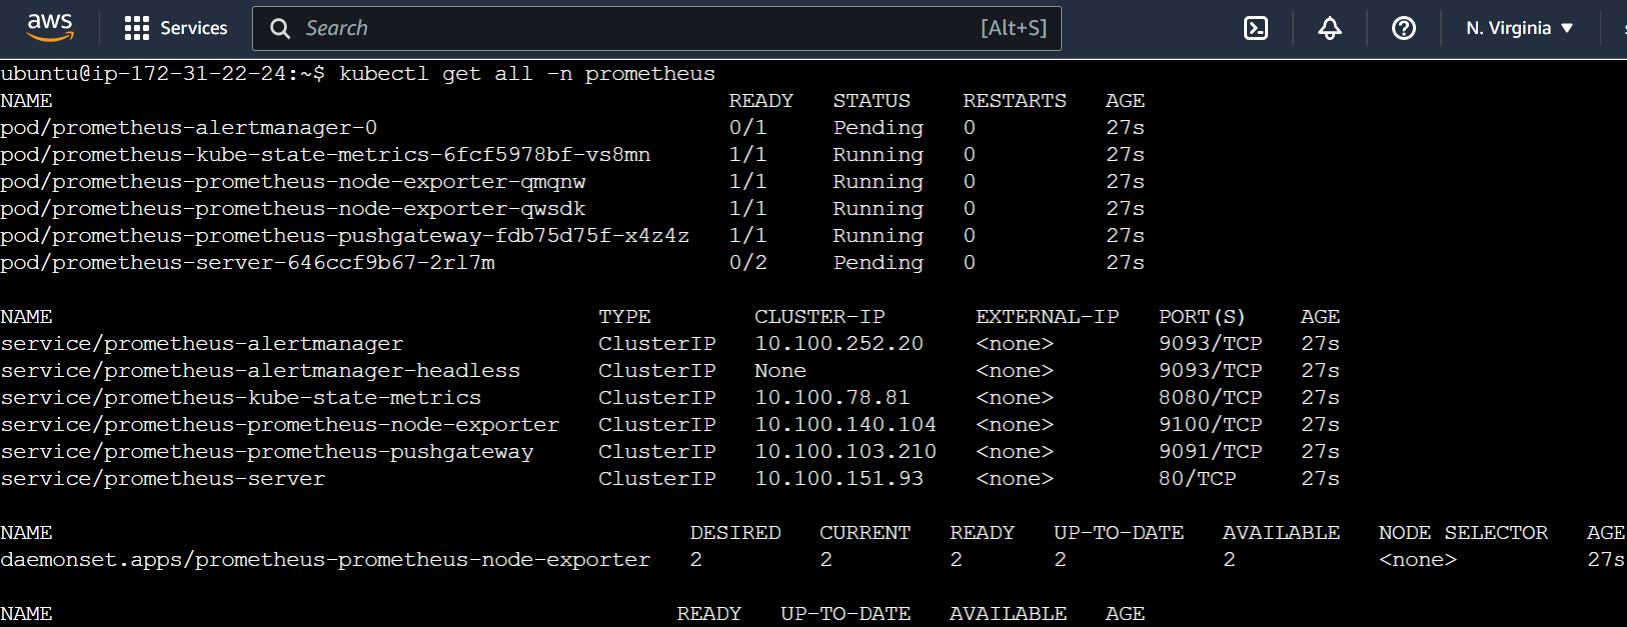
I noticed that not all servers are running. To fix this we are doing the following steps:
oidc_id=$(aws eks describe-cluster --name eks4 --query "cluster.identity.oidc.issuer" --output text | cut -d '/' -f 5)
aws iam list-open-id-connect-providers | grep $oidc_id | cut -d "/" -f4

eksctl utils associate-iam-oidc-provider --cluster eks4 --approve
Add IAM Role using eksctl with your cluster name.
eksctl create iamserviceaccount \
  --name ebs-csi-controller-sa \
  --namespace kube-system \
  --cluster eks4 \
  --attach-policy-arn arn:aws:iam::aws:policy/service-role/AmazonEBSCSIDriverPolicy \
  --approve \
  --role-only \
  --role-name AmazonEKS_EBS_CSI_DriverRole

Then add EBS CSI to eks by running the following command
Enter your account ID and cluster name.
eksctl create addon --name aws-ebs-csi-driver --cluster eks4 --service-account-role-arn arn:aws:iam::xxxxxxxxx:role/AmazonEKS_EBS_CSI_DriverRole --force

Finally, all pods are running now.
View the Prometheus dashboard by forwarding the deployment ports

Open different browser and connect to your EC2 instance and run curl localhost:9090/graph

Install Grafana
Add the Grafana helm chart repository. Later, Update the helm chart repository.
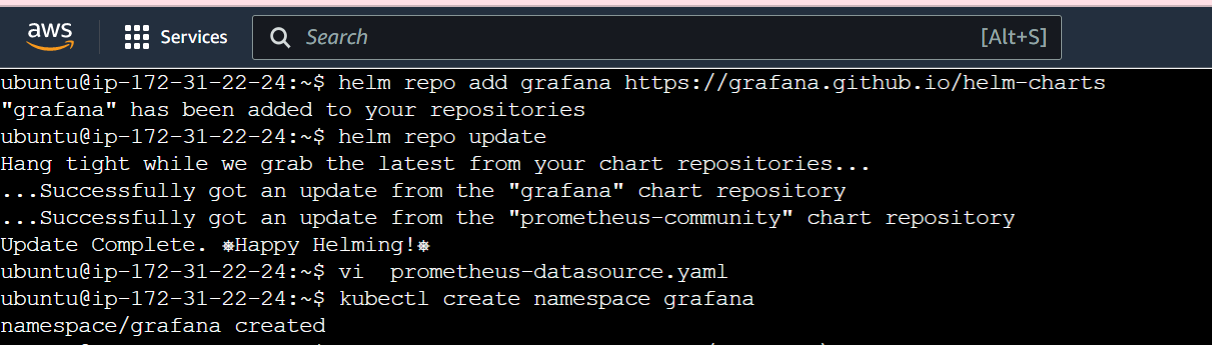
helm repo add grafana https://grafana.github.io/helm-charts
helm repo update
Now we need to create a Prometheus data source so that Grafana can access the Kubernetes metrics. Create a yaml file prometheus-datasource.yaml and save the following data source configuration into it -
datasources:
  datasources.yaml:
    apiVersion: 1
    datasources:
    - name: Prometheus
      type: prometheus
      url: http://prometheus-server.prometheus.svc.cluster.local
      access: proxy
      isDefault: true
Create a namespace grafana
kubectl create namespace grafana
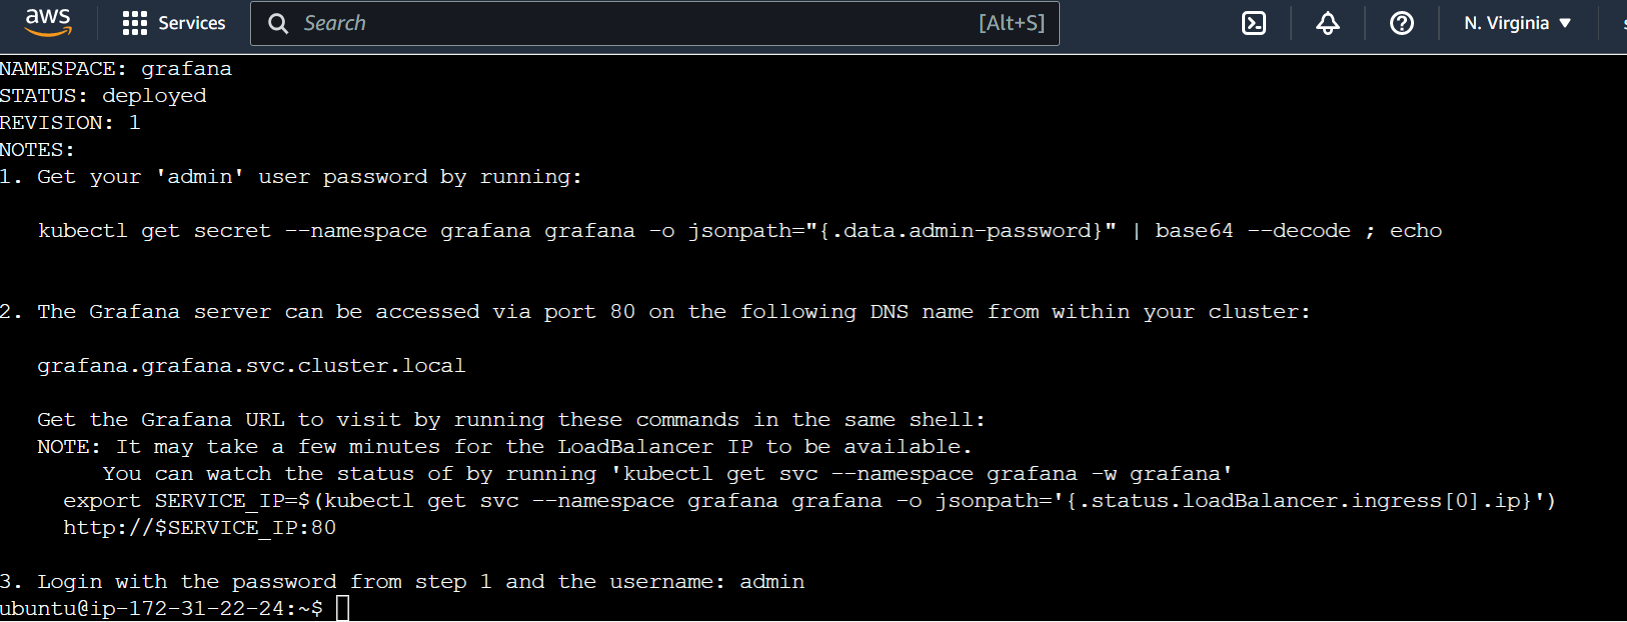
Install the Grafana
helm install grafana grafana/grafana \
    --namespace grafana \
    --set persistence.storageClassName="gp2" \
    --set persistence.enabled=true \
    --set adminPassword='EKS!sAWSome' \
    --values prometheus-datasource.yaml \
    --set service.type=LoadBalancer
This command will create the Grafana service with an external load balancer to get the public view.
Verify the Grafana installation by using the following kubectl command -
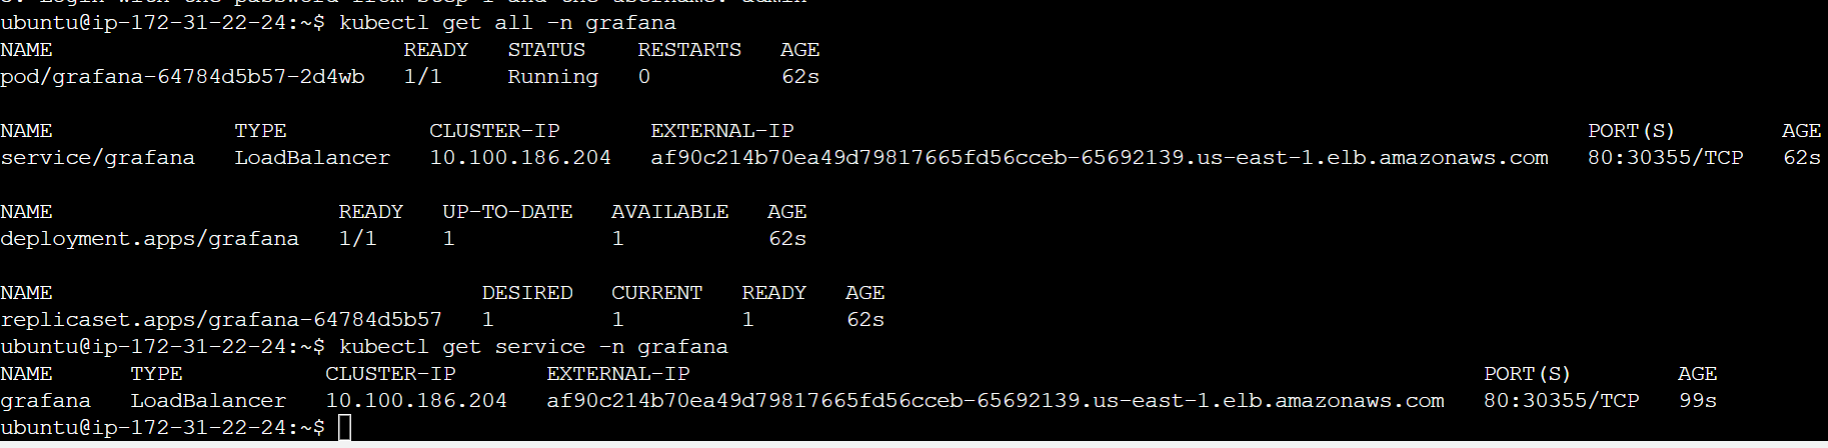
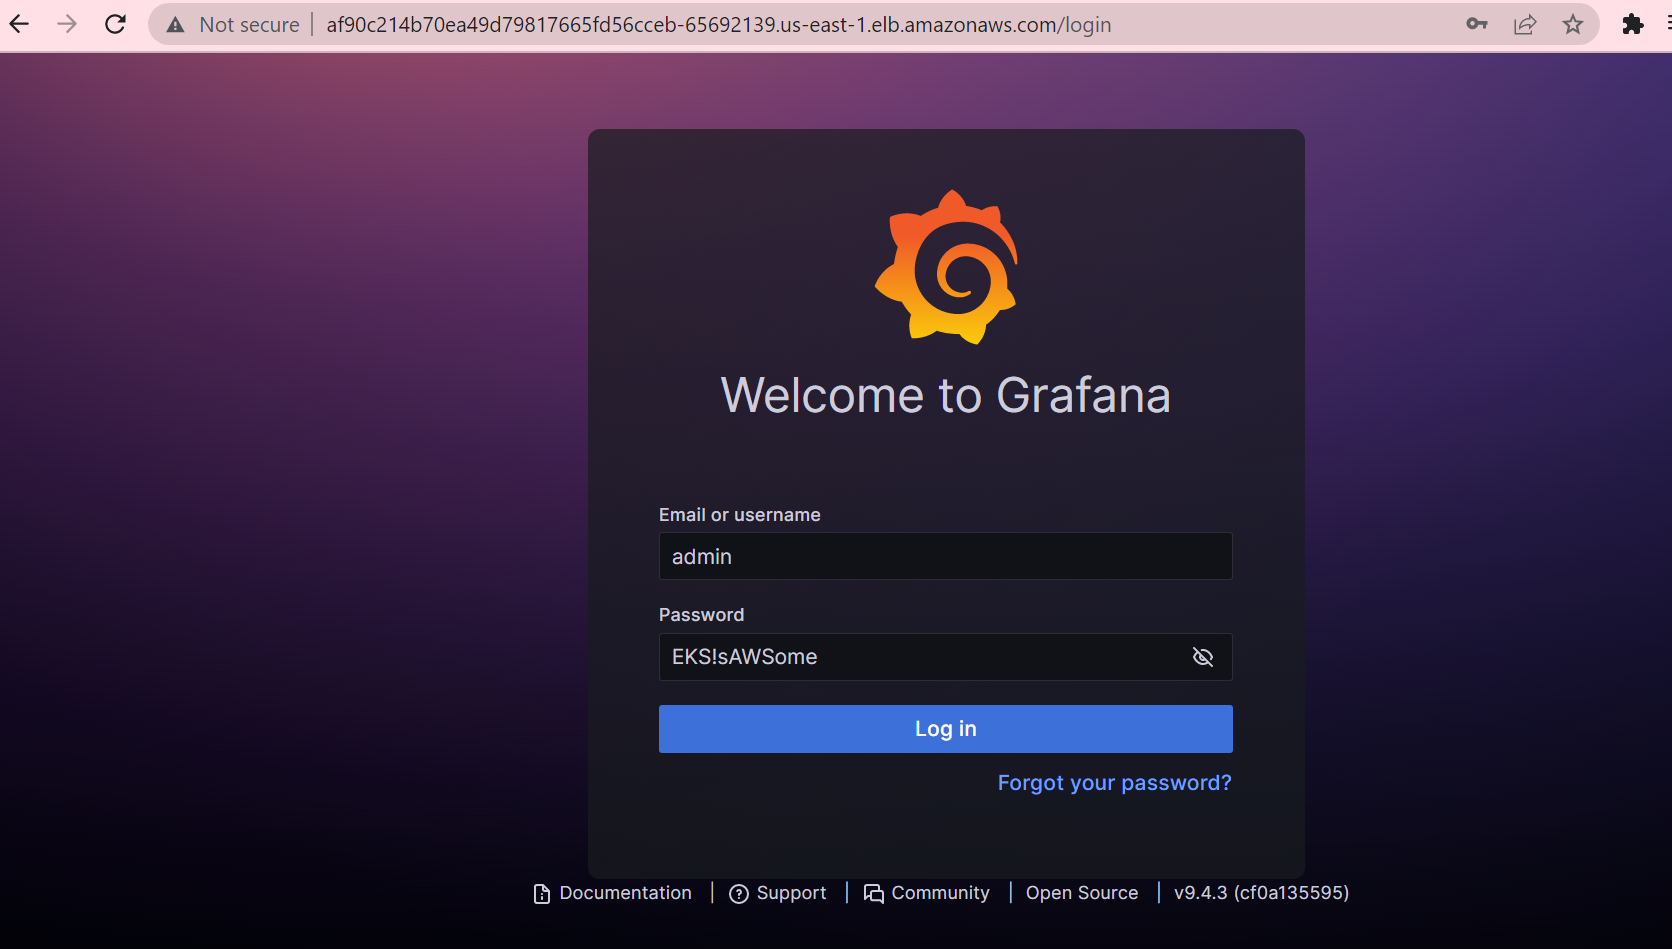
Copy External IP address and open it in the browser -
Password you mentioned as EKS!sAWSome while creating Grafana
Import Grafana dashboard from Grafana Labs
Now we have set up everything in terms of Prometheus and Grafana. For the custom Grafana Dashboard, we are going to use the open source grafana dashboard. For this session, I am going to import a dashboard 6417

Load and select the source as Prometheus
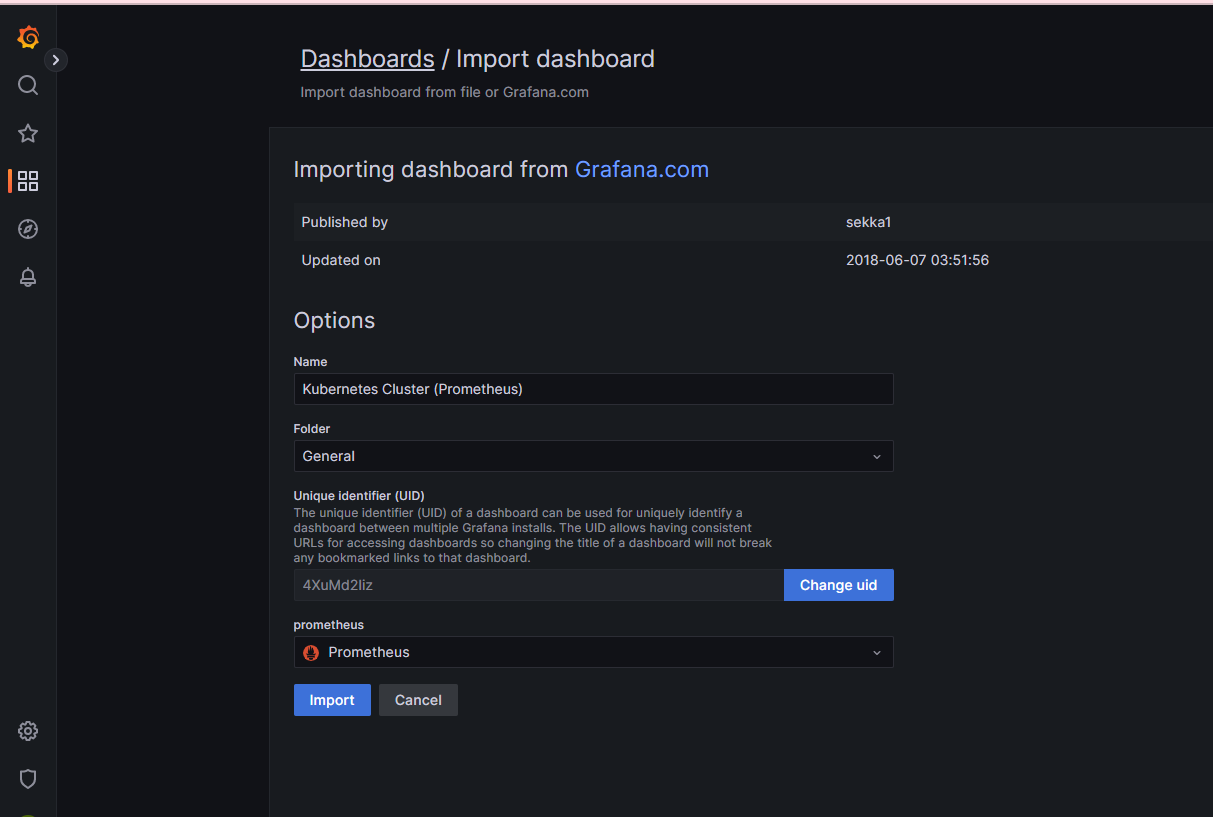
Import it.
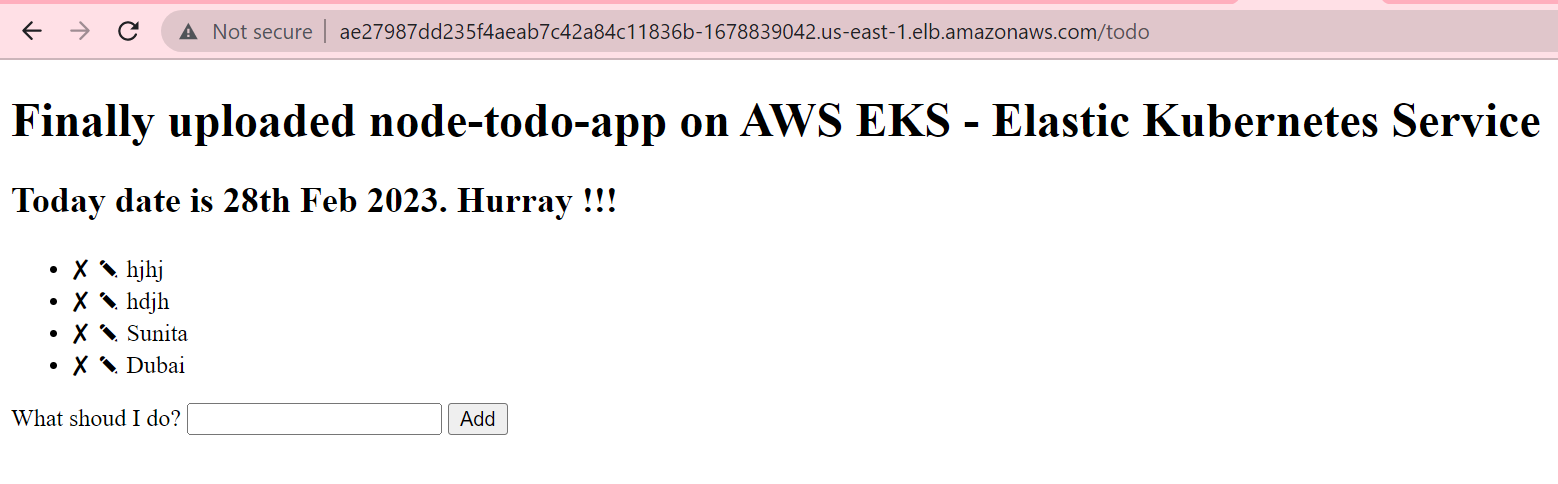
Deploy a Node.js application and monitor it on Grafana
To make use of Grafana dashboard, we will deploy Node.js application on Kubernetes. Download deployment.yml file from the below repository.
https://github.com/sunitabachhav2007/node-todo-cicd
To deploy the Node.js application on kubernetes cluster user the following kubectl command. Verify the deployment by running the following kubectl command
kubectl apply -f deployment.yml
kubectl get deployment
kubectl get pods


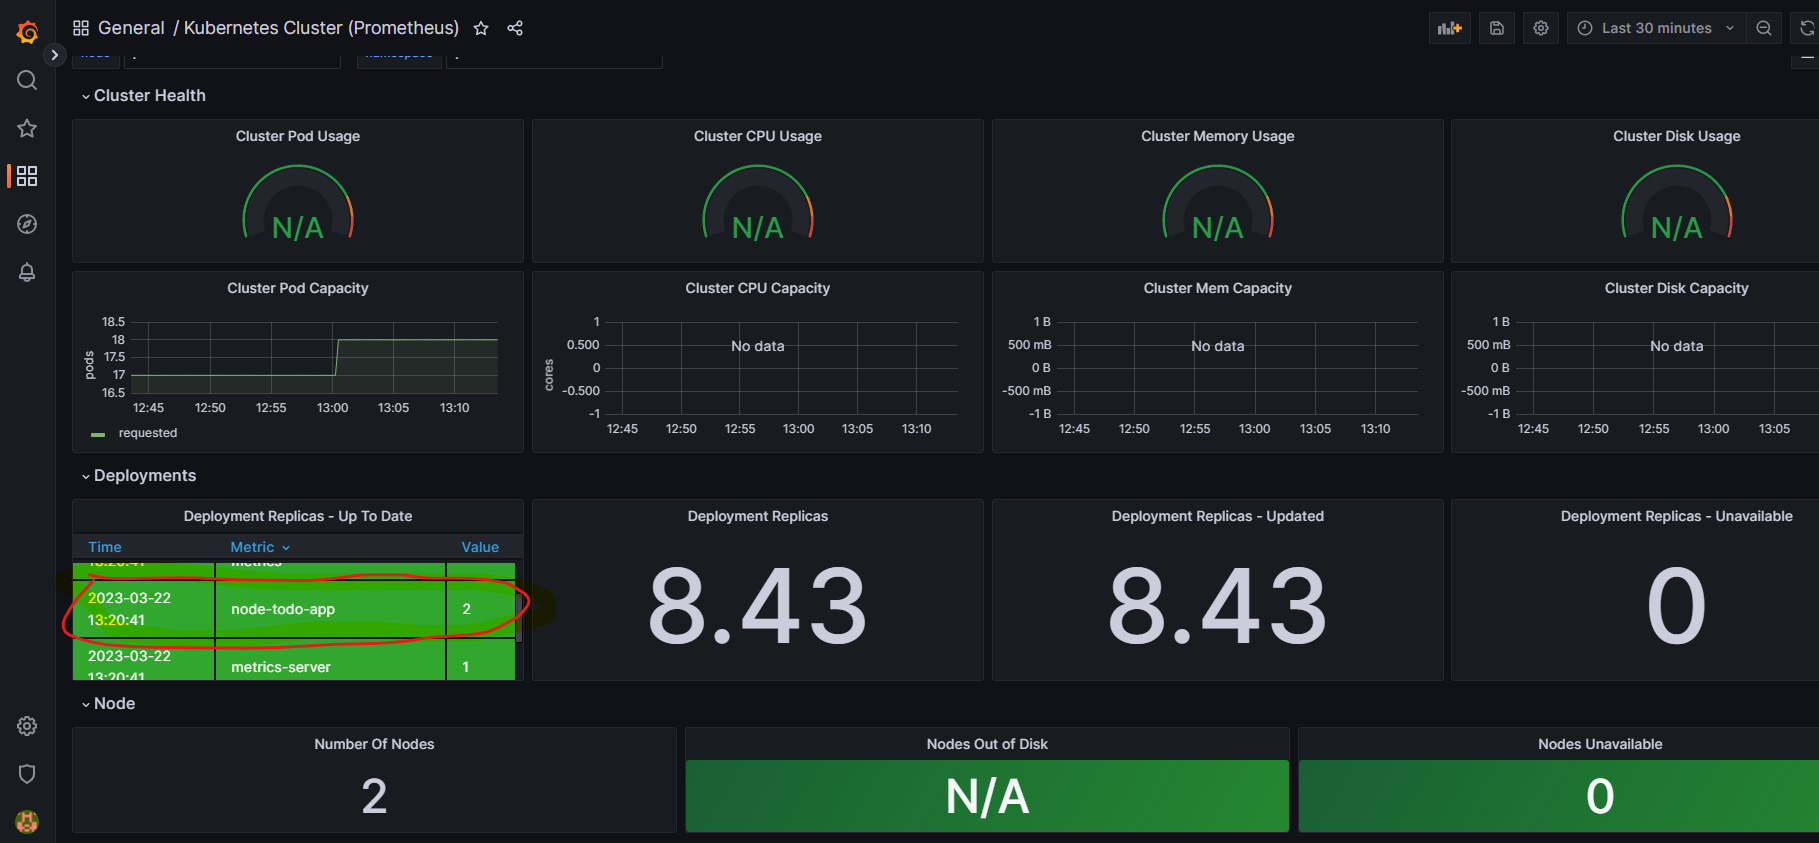
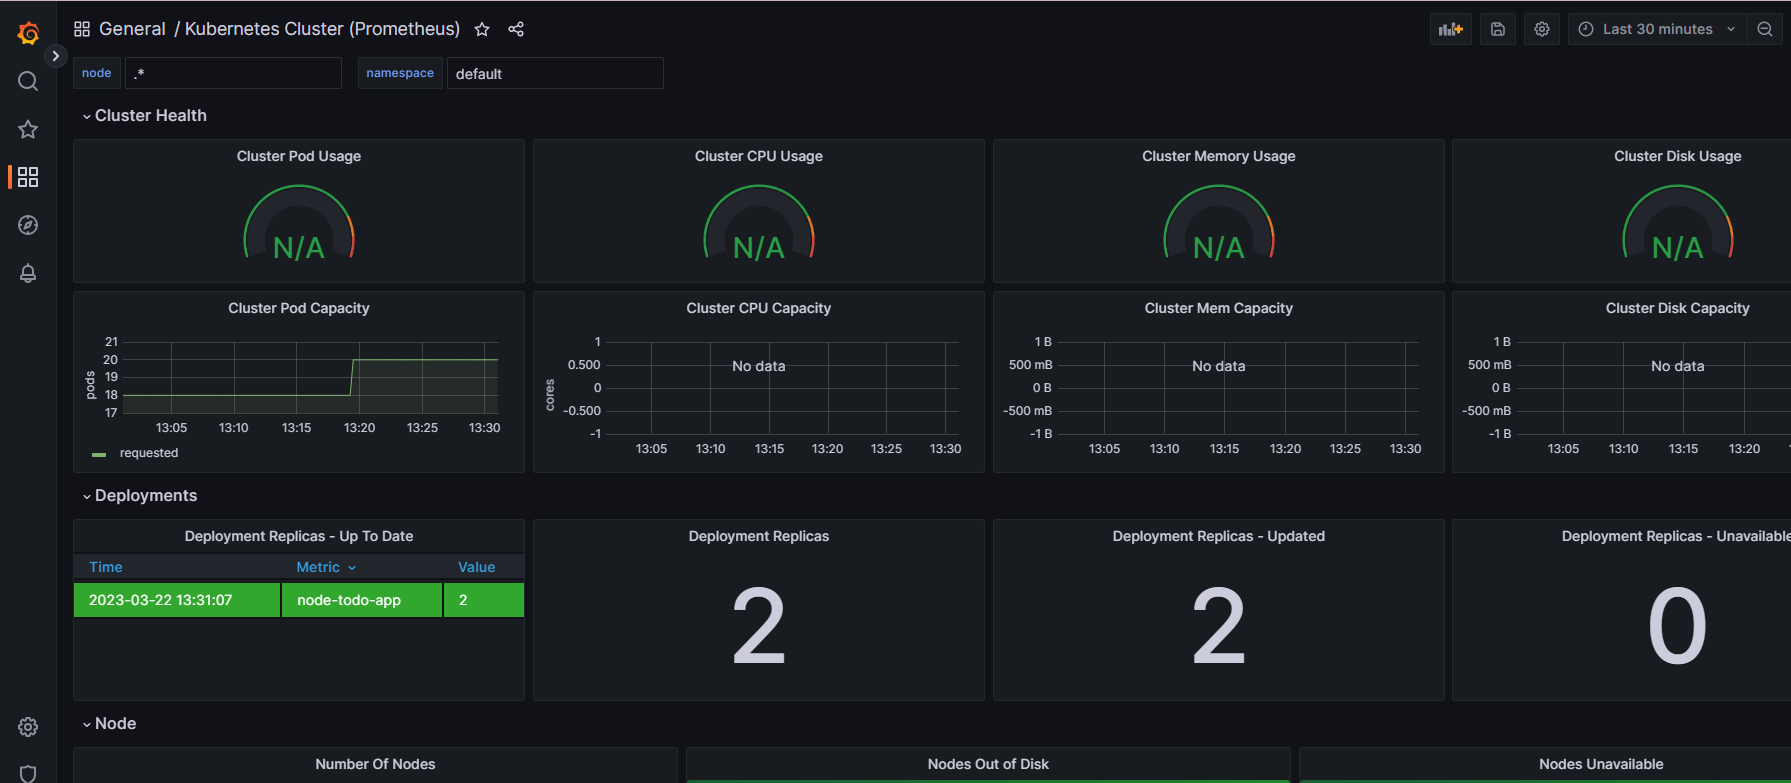
The Node.js Application is running successfully.
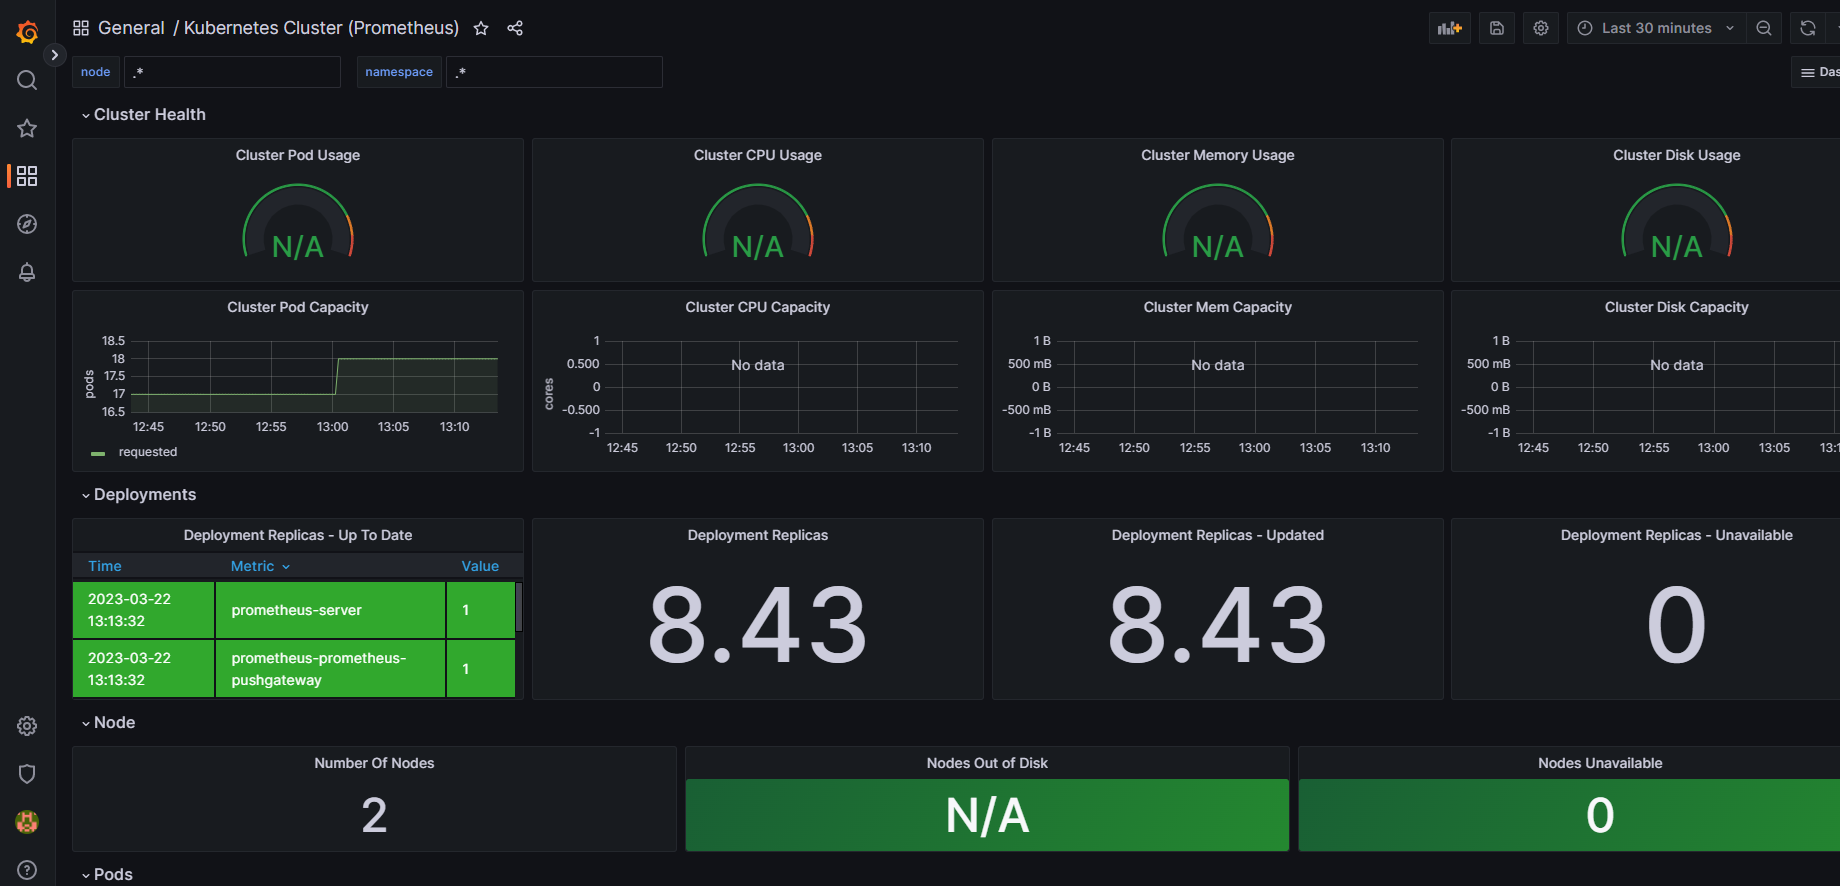
Refresh the Grafana dashboard to verify the deployment

Clean Up
In this stage, you're going to clean up and remove all resources which we created during the session. So that it will not be charged to you afterward.
- Delete EKS cluster with following command.
eksctl delete cluster --name eks4

- Delete EC2 Instance.
Thank you
I conclude this exercise will help you to understand the concepts of using kubernetes metrics monitoring using prometheus and grafana dashboard.
Thanks for reading to the end; I hope you gained some knowledge.