Deploy Netflix Clone CI-CD on AWS EKS - DevSecOps Practices

In this article, I am deploying a Netflix clone application. The deployment process will involve the utilization of Jenkins as a CI/CD tool to deploy our Netflix application on a Docker container and Kubernetes Cluster (Amazon EKS).
This project illustrates the process of integrating a variety of commonly employed software development tools to optimize the development workflow, enhance code quality, and establish image security through Trivy vulnerability scanning. Additionally, it highlights the automation of deployment on a Kubernetes cluster using GitOps ArgoCD and emphasizes the importance of closely monitoring your application's performance through Prometheus and Grafana.
Phase 1: Initial Setup and Deployment
Within this phase, our objective is to deploy the Netflix application on Docker, and in subsequent phases, we will proceed to establish a CI/CD pipeline for it.
Step 1: Launch EC2 (Ubuntu 22.04)
Select Ubuntu server. Instance type as t2.large. You can create a new key pair or use an existing one. Enable HTTP and HTTPS settings in the Security Group. EBS Volumes as 30GB.

Create and associate Elastic IP to the above instance.


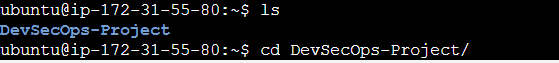
Step 2: Clone the Code
Update all the packages and then clone the code.
Clone your application's code repository onto the EC2 instance:
git clone https://github.com/sunitabachhav2007/DevSecOps-Project.git
Step 3: Install Docker and Run the App Using a Container
Set up Docker on the EC2 instance:
sudo apt-get update
sudo apt-get install docker.io -y
sudo usermod -aG docker $USER  # Replace with your system's username, e.g., 'ubuntu'
newgrp docker
sudo chmod 777 /var/run/docker.sock
Build and run your application using Docker containers:
docker build -t netflix .
docker run -d --name netflix -p 8081:80 netflix:latest

#to delete
docker stop <containerid>
docker rmi -f netflix

It will show an error cause you need TMDB API key
Step 4: Get the TMDB API Key
Open a web browser and navigate to TMDB (The Movie Database) website.
Click on "Login" and create an account.
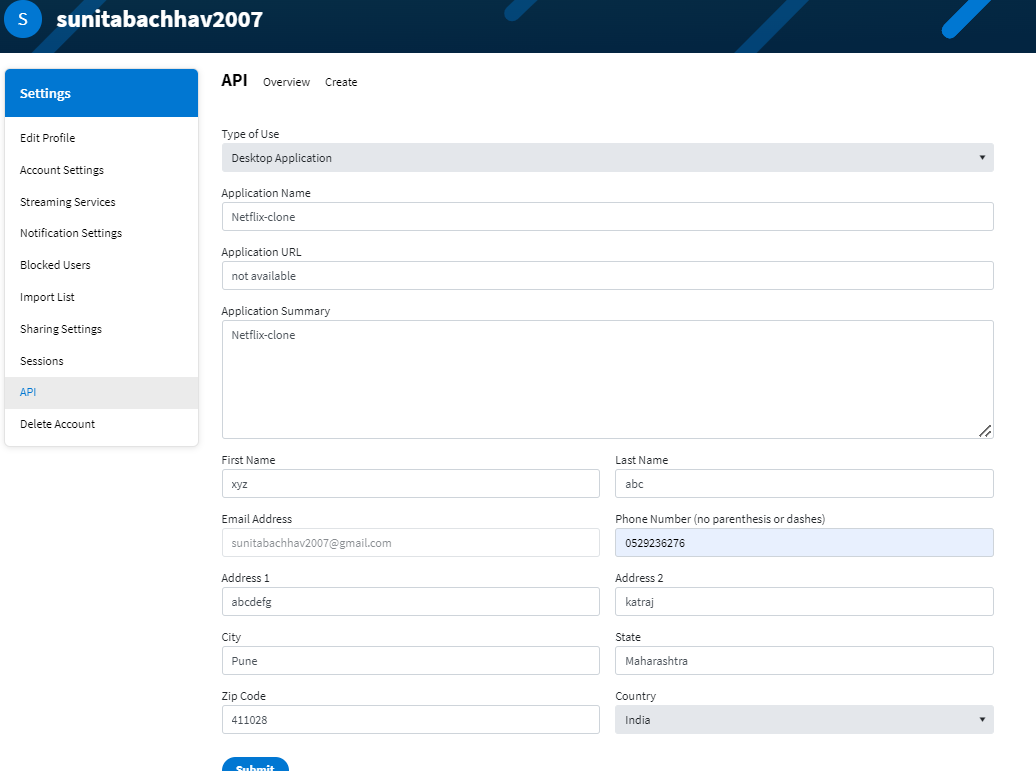
Once logged in, go to your profile and select "Settings."
Click on "API" from the left-side panel.
Create a new API key by clicking "Create" and accepting the terms and conditions.
Provide the required basic details and click "Submit."
You will receive your TMDB API key.

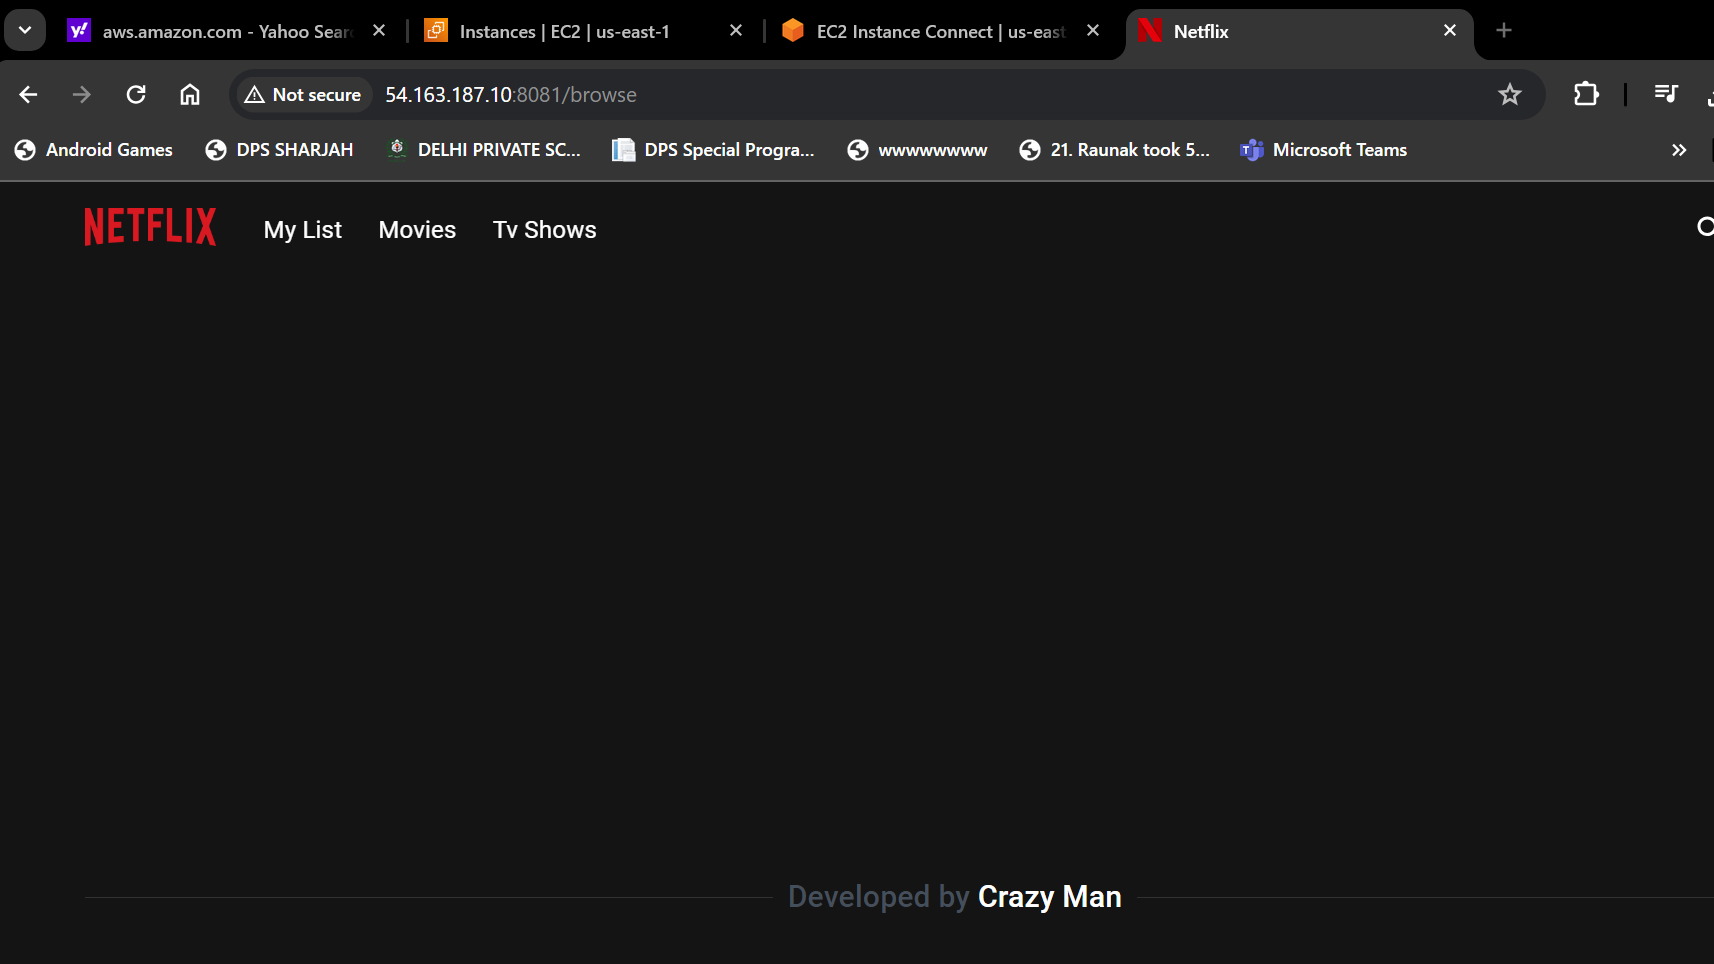
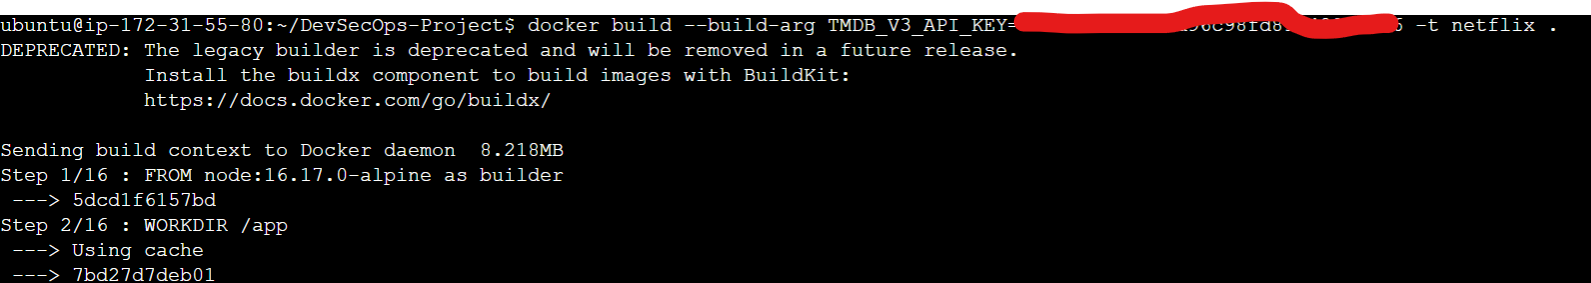
Now delete the existing docker container and create a new one with the above API key.

docker build --build-arg TMDB_V3_API_KEY=<your-api-key> -t netflix .

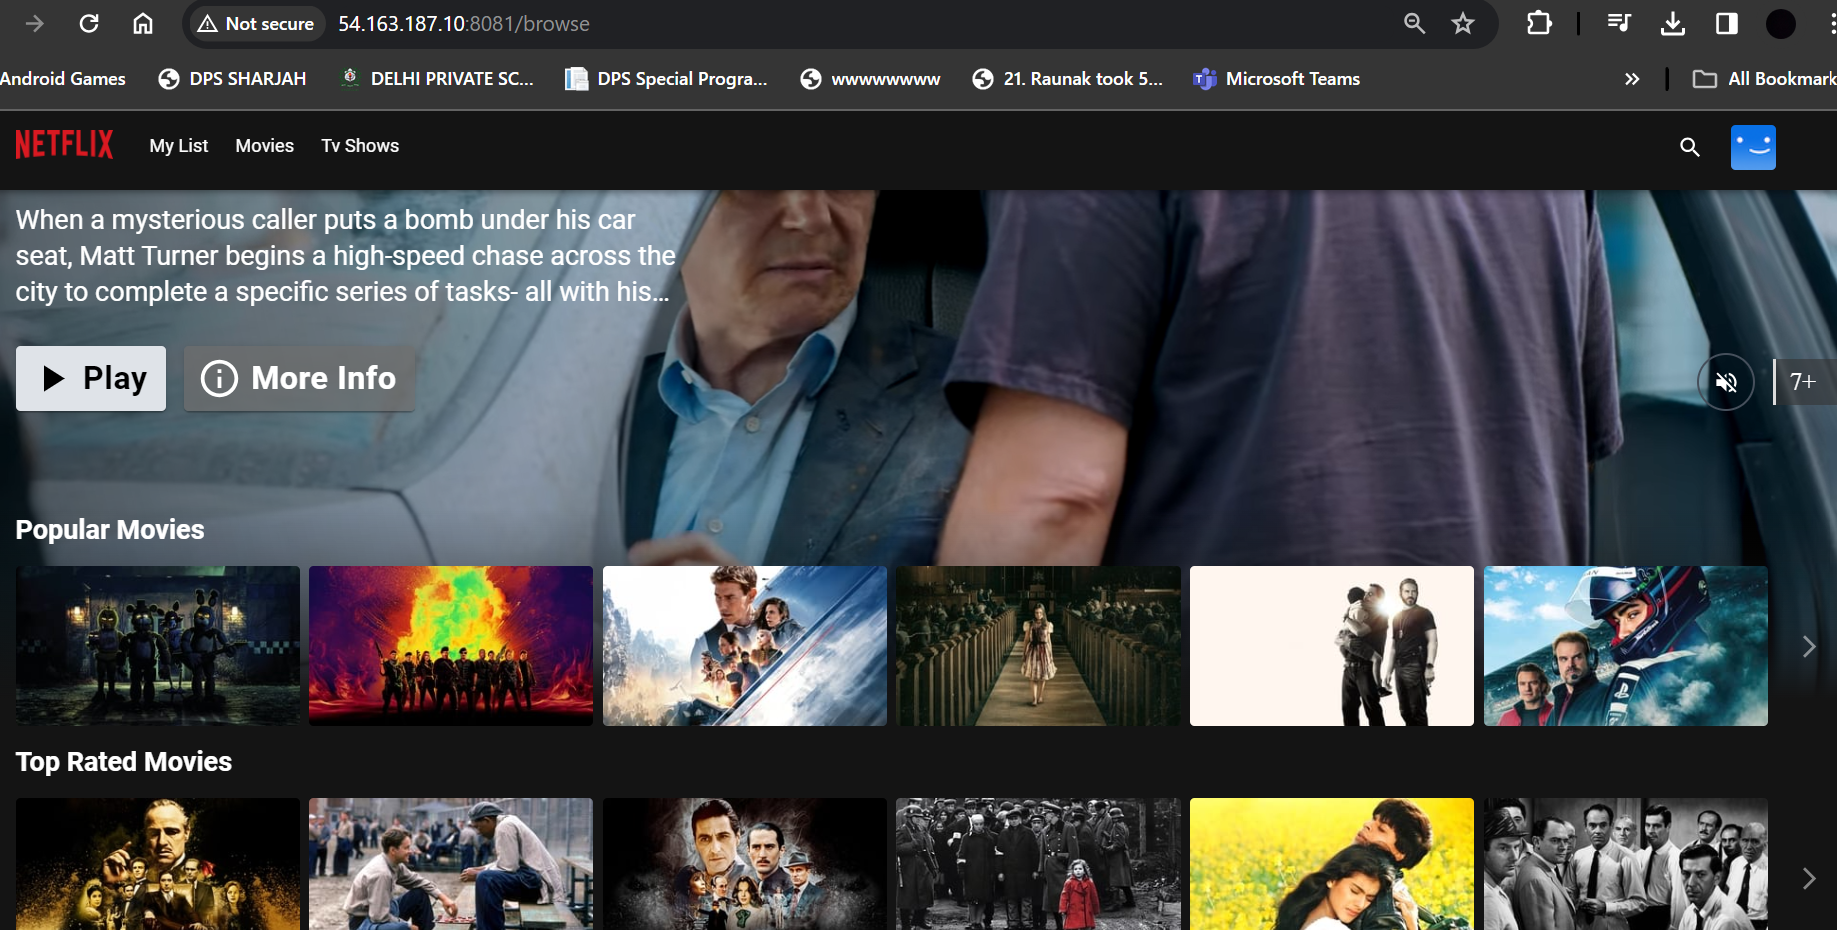
Now Netflix clone is working successfully.
Phase 2: Security
SonarQube is primarily used for static code analysis and code quality improvement across various programming languages, while Trivy specializes in scanning container images for security vulnerabilities, making it a crucial tool in containerized environments.
Install SonarQube and Trivy
Install SonarQube and Trivy on the EC2 instance to scan for vulnerabilities.
docker run -d --name sonar -p 9000:9000 sonarqube:lts-community

To access SonarQube, publicIP:9000 (by default username & password is admin)
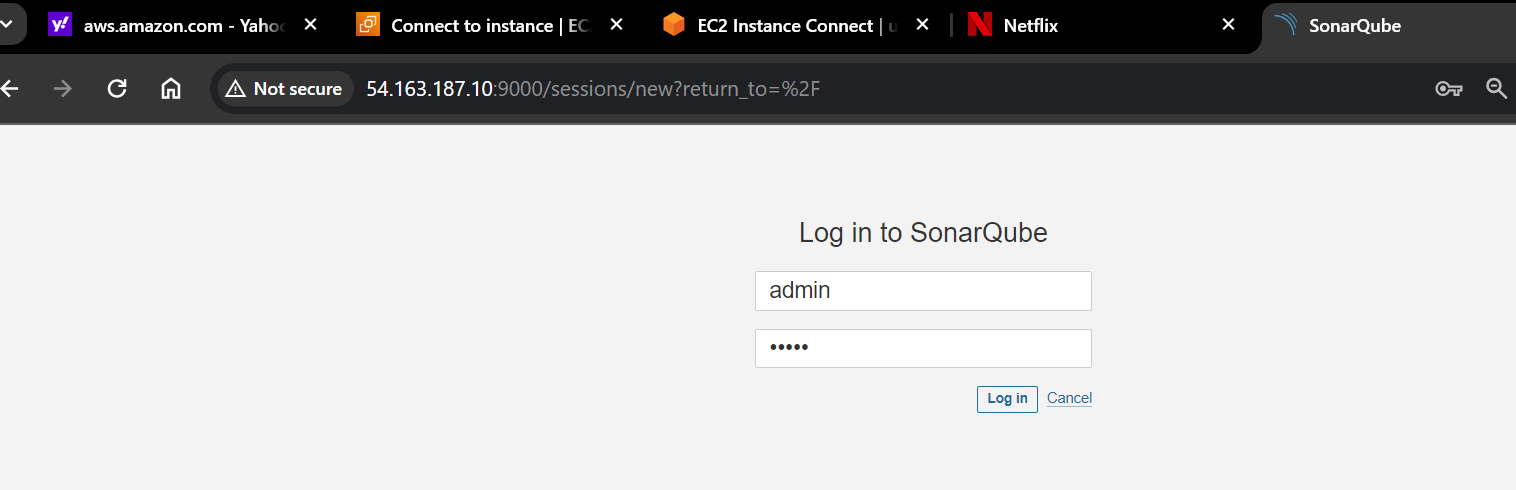
Update with new Password

To install Trivy:
sudo apt-get install wget apt-transport-https gnupg lsb-release
wget -qO - https://aquasecurity.github.io/trivy-repo/deb/public.key | sudo apt-key add -
echo deb https://aquasecurity.github.io/trivy-repo/deb $(lsb_release -sc) main | sudo tee -a /etc/apt/sources.list.d/trivy.list
sudo apt-get update
sudo apt-get install trivy
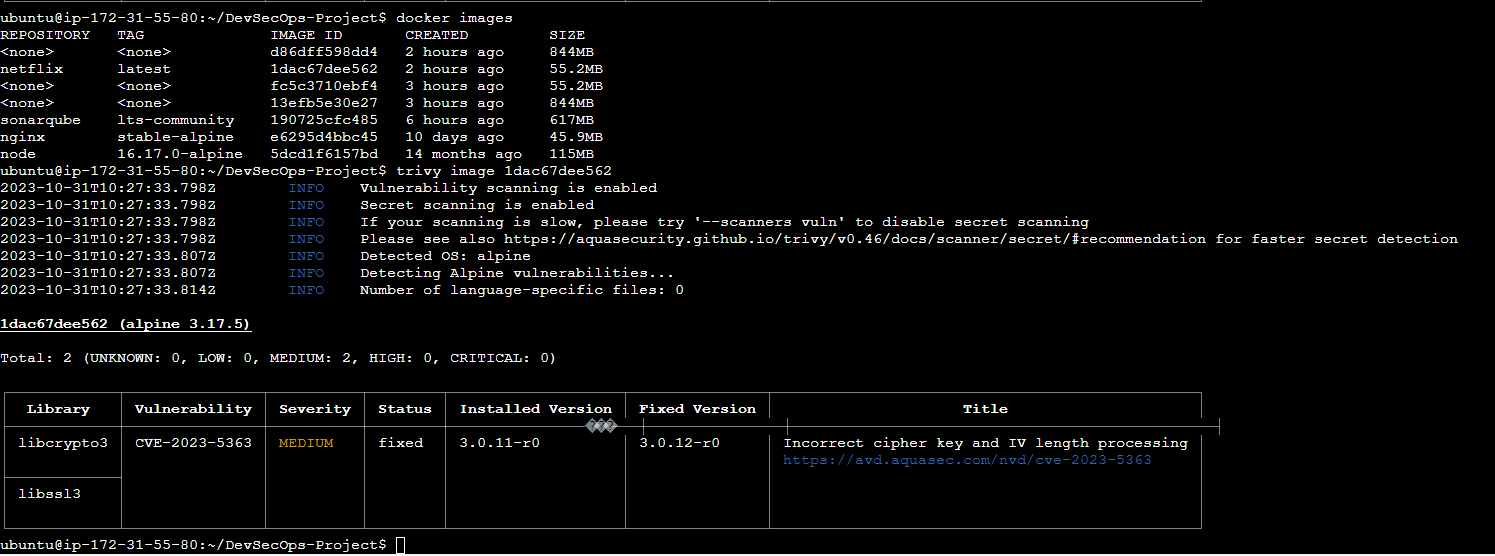
To scan image using trivy.
trivy image <imageid>
Phase 3: CI/CD Setup
Our Jenkins pipeline is a powerhouse, integrating SonarQube for code quality, Trivy for container security, and OWASP for web app safety. It pulls code from GitHub, ensuring automated, high-quality, and secure software development.
Install Jenkins
Install Jenkins on the EC2 instance to automate deployment: Install Java
sudo apt update
sudo apt install fontconfig openjdk-17-jre
java -version
openjdk version "17.0.8" 2023-07-18
OpenJDK Runtime Environment (build 17.0.8+7-Debian-1deb12u1)
OpenJDK 64-Bit Server VM (build 17.0.8+7-Debian-1deb12u1, mixed mode, sharing)

#jenkins
sudo wget -O /usr/share/keyrings/jenkins-keyring.asc \
https://pkg.jenkins.io/debian-stable/jenkins.io-2023.key
echo deb [signed-by=/usr/share/keyrings/jenkins-keyring.asc] \
https://pkg.jenkins.io/debian-stable binary/ | sudo tee \
/etc/apt/sources.list.d/jenkins.list > /dev/null
sudo apt-get update
sudo apt-get install jenkins
sudo systemctl start jenkins
sudo systemctl enable jenkins
jenkins is installed on EC2 instance.

Access Jenkins in a web browser using the public IP of your EC2 instance.
publicIp:8080
Password you will get from /var/lib/jenkins/secrets/initialAdminPassword

Then Select Install selected Plugins.
Then change its password.

Jenkins Getting Started Screen.
Install Plugins like JDK, Sonarqube Scanner, NodeJs, OWASP Dependency Check
Goto Manage Jenkins →Plugins → Available Plugins →
Install below plugins
1 Eclipse Temurin Installer (Install without restart)
2 SonarQube Scanner (Install without restart)
3 NodeJs Plugin (Install Without restart)
4 Email Extension Plugin

Configure Java and Nodejs in Global Tool Configuration
Goto Manage Jenkins → Tools → Install JDK(17) and NodeJs(16)→ Click on Apply and Save


Configure Sonar Server in Manage Jenkins
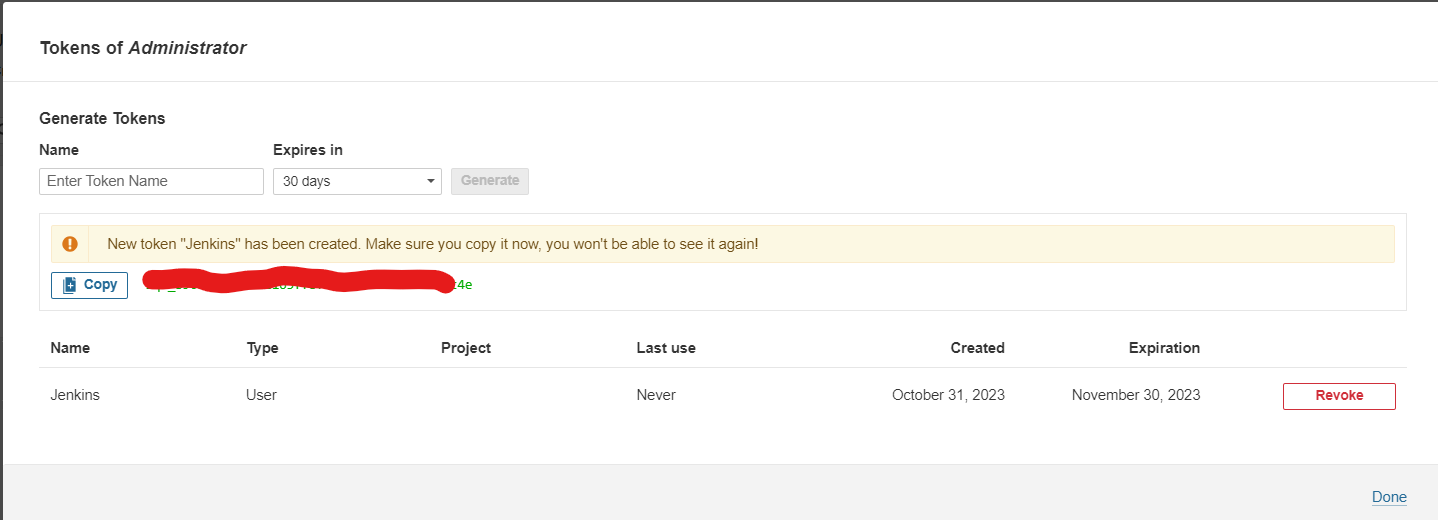
Grab the Public IP Address of your EC2 Instance, Sonarqube works on Port 9000, so <Public IP>:9000. Goto your Sonarqube Server. Click on Administration → Security → Users → Click on Tokens and Update Token → Give it a name → and click on Generate Token

Goto Jenkins Dashboard → Manage Jenkins → Credentials → Add Secret Text. (Put copied token)
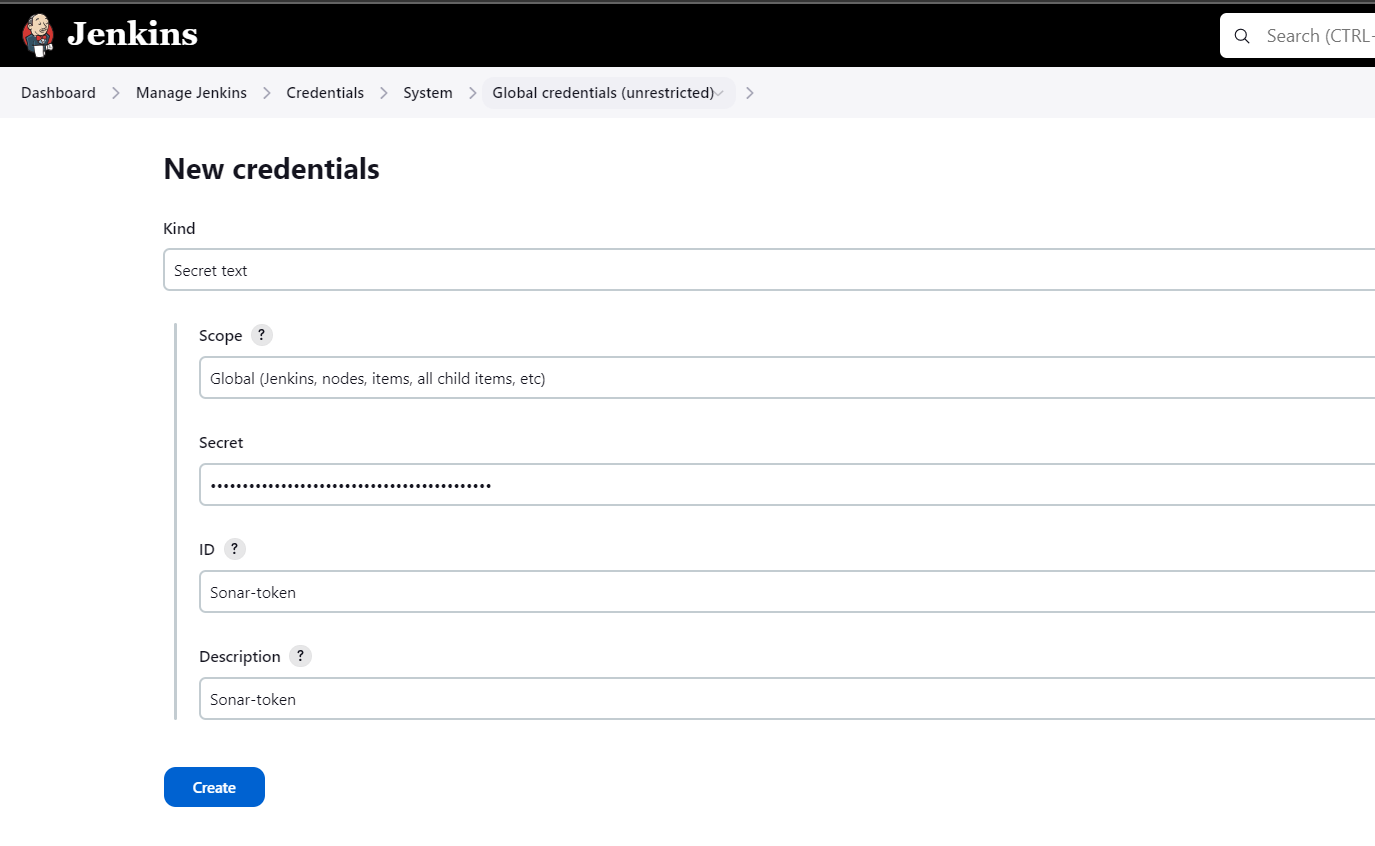
You will this page once you click on Create.

Goto Manage Jenkins == >System

Goto Manage Jenkins ==> Tools

Configure CI/CD Pipeline in Jenkins
Create a CI/CD pipeline in Jenkins to automate your application deployment.

pipeline {
    agent any
    tools {
        jdk 'jdk17'
        nodejs 'node16'
    }
    environment {
        SCANNER_HOME = tool 'sonar-scanner'
    }
    stages {
        stage('clean workspace') {
            steps {
                cleanWs()
            }
        }
        stage('Checkout from Git') {
            steps {
                git branch: 'main', url: 'https://github.com/sunitabachhav2007/DevSecOps-Project.git'
            }
        }
        stage("Sonarqube Analysis") {
            steps {
                withSonarQubeEnv('sonar-server') {
                    sh '''$SCANNER_HOME/bin/sonar-scanner -Dsonar.projectName=Netflix \
                    -Dsonar.projectKey=Netflix'''
                }
            }
        }
        stage("quality gate") {
            steps {
                script {
                    waitForQualityGate abortPipeline: false, credentialsId: 'Sonar-token'
                }
            }
        }
        stage('Install Dependencies') {
            steps {
                sh "npm install"
            }
        }
    }
}
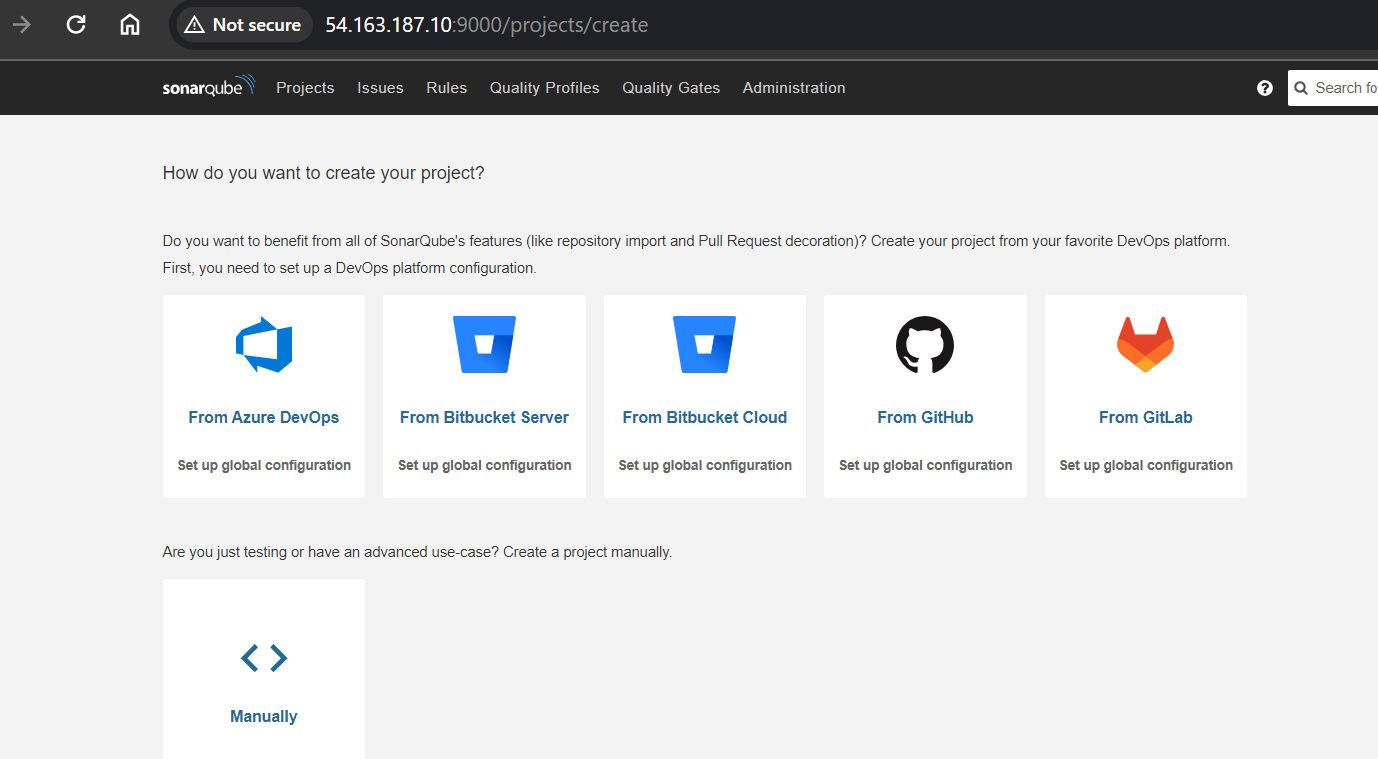
Create code in sonarqube.


and then click on Generate

Build now

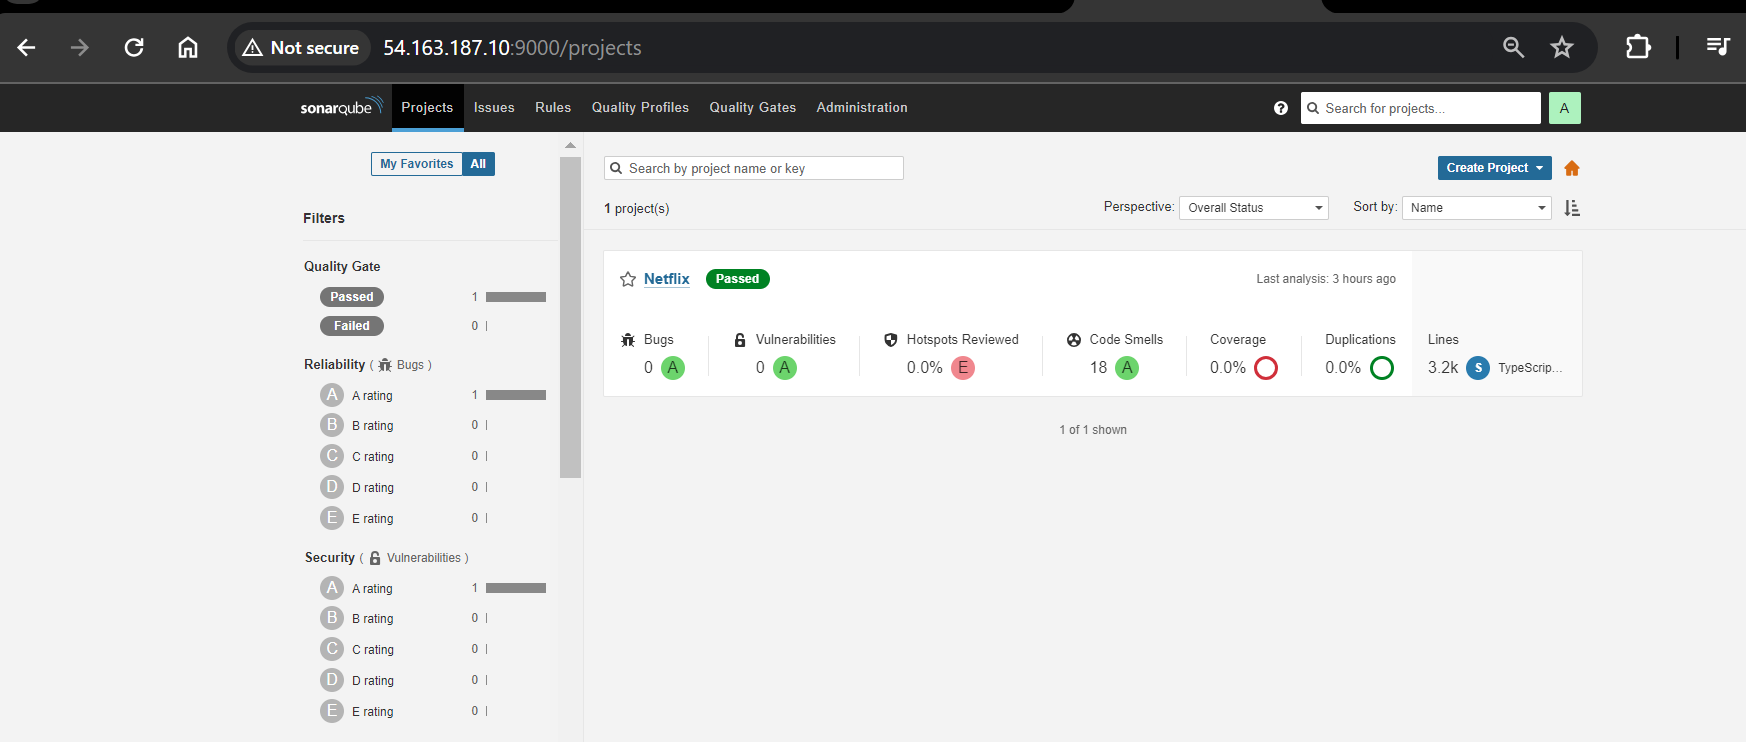
You can see the report has been generated and the status shows as passed. You can see that there are 3.2k lines it scanned. To see a detailed report, you can go to issues.

Install Dependency-Check and Docker Tools in Jenkins
Install Dependency-Check Plugin and Install Docker Tools and Docker Plugins:
Go to "Dashboard" in your Jenkins web interface.
Navigate to "Manage Jenkins" → "Manage Plugins."
Click on the "Available" tab and search for "OWASP Dependency-Check."
Check the checkbox for "OWASP Dependency-Check".
Click on the "Available" tab and search for "Docker."
Check the following Docker-related plugins:
Docker
Docker Commons
Docker Pipeline
Docker API
docker-build-step
click on the "Install without restart" button.

Add DockerHub Username and Password under Global Credentials

Configure Dependency-Check Tool:
After installing the Dependency-Check plugin, you need to configure the tool.
Go to "Dashboard" → "Manage Jenkins" → "Global Tool Configuration."
Find the section for "Dependency-Check."
Add the tool's name, e.g., "DP-Check."
Save your settings.


Now, you have installed the Dependency-Check plugin, configured the tool, and added Docker-related plugins along with your DockerHub credentials in Jenkins. You can now proceed with configuring your Jenkins pipeline to include these tools and credentials in your CI/CD process.
In below pipeline script change , in Docker build and push stage, update TMDB_V3_API_KEY=<your TMDB API key> according to your API key.
pipeline{
    agent any
    tools{
        jdk 'jdk17'
        nodejs 'node16'
    }
    environment {
        SCANNER_HOME=tool 'sonar-scanner'
    }
    stages {
        stage('clean workspace'){
            steps{
                cleanWs()
            }
        }
        stage('Checkout from Git'){
            steps{
                git branch: 'main', url: 'https://github.com/sunitabachhav2007/DevSecOps-Project.git'
            }
        }
        stage("Sonarqube Analysis "){
            steps{
                withSonarQubeEnv('sonar-server') {
                    sh ''' $SCANNER_HOME/bin/sonar-scanner -Dsonar.projectName=Netflix \
                    -Dsonar.projectKey=Netflix '''
                }
            }
        }
        stage("quality gate"){
           steps {
                script {
                    waitForQualityGate abortPipeline: false, credentialsId: 'Sonar-token'
                }
            }
        }
        stage('Install Dependencies') {
            steps {
                sh "npm install"
            }
        }
        stage('OWASP FS SCAN') {
            steps {
                dependencyCheck additionalArguments: '--scan ./ --disableYarnAudit --disableNodeAudit', odcInstallation: 'DP-Check'
                dependencyCheckPublisher pattern: '**/dependency-check-report.xml'
            }
        }
        stage('TRIVY FS SCAN') {
            steps {
                sh "trivy fs . > trivyfs.txt"
            }
        }
        stage("Docker Build & Push"){
            steps{
                script{
                   withDockerRegistry(credentialsId: 'docker', toolName: 'docker'){
                       sh "docker build --build-arg TMDB_V3_API_KEY=<your TMDB API key> -t netflix ."
                       sh "docker tag netflix sunitabachhav2007/netflix:latest "
                       sh "docker push sunitabachhav2007/netflix:latest "
                    }
                }
            }
        }
        stage("TRIVY"){
            steps{
                sh "trivy image sunitabachhav2007/netflix:latest > trivyimage.txt"
            }
        }
        stage('Deploy to container'){
            steps{
                sh 'docker run -d --name netflix -p 8081:80 sunitabachhav2007/netflix:latest'
            }
        }
    }
}
After the build, the stage view is below

SonarQube Output:
Netflix Application is created and running successfully by Jenkins CI-CD pipeline.

When you log in to Dockerhub, you will see a new image is created

Phase 4: Prometheus Setup
Set up Prometheus and Grafana to monitor your application. Prometheus is a monitoring and alerting tool that collects metrics and helps track the health of systems and applications.
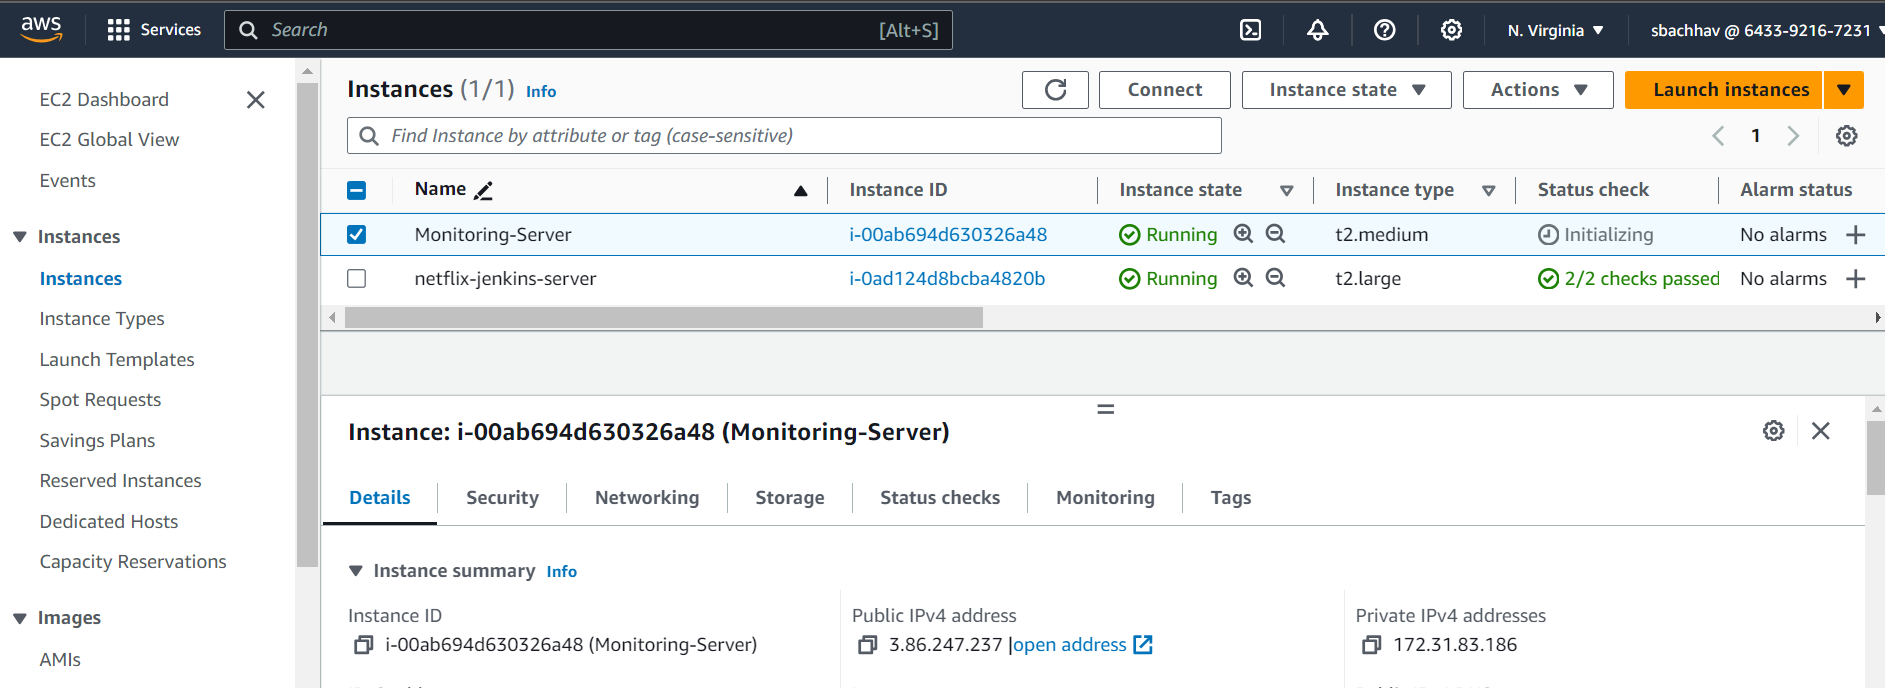
Launch a new instance (Ubuntu). Instance type as t2.medium. You can create a new key pair or use an existing one. Enable HTTP and HTTPS settings in the Security Group. EBS Volumes as 20GB.
Installing Prometheus
First, create a dedicated Linux user for Prometheus and download Prometheus:
sudo useradd --system --no-create-home --shell /bin/false prometheus
wget https://github.com/prometheus/prometheus/releases/download/v2.47.1/prometheus-2.47.1.linux-amd64.tar.gz
Extract Prometheus files, move them, and create directories:
tar -xvf prometheus-2.47.1.linux-amd64.tar.gz
cd prometheus-2.47.1.linux-amd64/
sudo mkdir -p /data /etc/prometheus
sudo mv prometheus promtool /usr/local/bin/
sudo mv consoles/ console_libraries/ /etc/prometheus/
sudo mv prometheus.yml /etc/prometheus/prometheus.yml
Set ownership for directories:
sudo chown -R prometheus:prometheus /etc/prometheus/ /data/
Create a systemd unit configuration file for Prometheus:
sudo nano /etc/systemd/system/prometheus.service
Add the following content to the prometheus.service file:
[Unit]
Description=Prometheus
Wants=network-online.target
After=network-online.target

StartLimitIntervalSec=500
StartLimitBurst=5

[Service]
User=prometheus
Group=prometheus
Type=simple
Restart=on-failure
RestartSec=5s
ExecStart=/usr/local/bin/prometheus \
  --config.file=/etc/prometheus/prometheus.yml \
  --storage.tsdb.path=/data \
  --web.console.templates=/etc/prometheus/consoles \
  --web.console.libraries=/etc/prometheus/console_libraries \
  --web.listen-address=0.0.0.0:9090 \
  --web.enable-lifecycle

[Install]
WantedBy=multi-user.target
Here's a brief explanation of the key parts in this prometheus.service file:
UserandGroupspecify the Linux user and group under which Prometheus will run.ExecStartis where you specify the Prometheus binary path, the location of the configuration file (prometheus.yml), the storage directory, and other settings.web.listen-addressconfigures Prometheus to listen on all network interfaces on port 9090.web.enable-lifecycleallows for management of Prometheus through API calls.
Enable and start Prometheus:
sudo systemctl enable prometheus
sudo systemctl start prometheus
Verify Prometheus's status:
sudo systemctl status prometheus

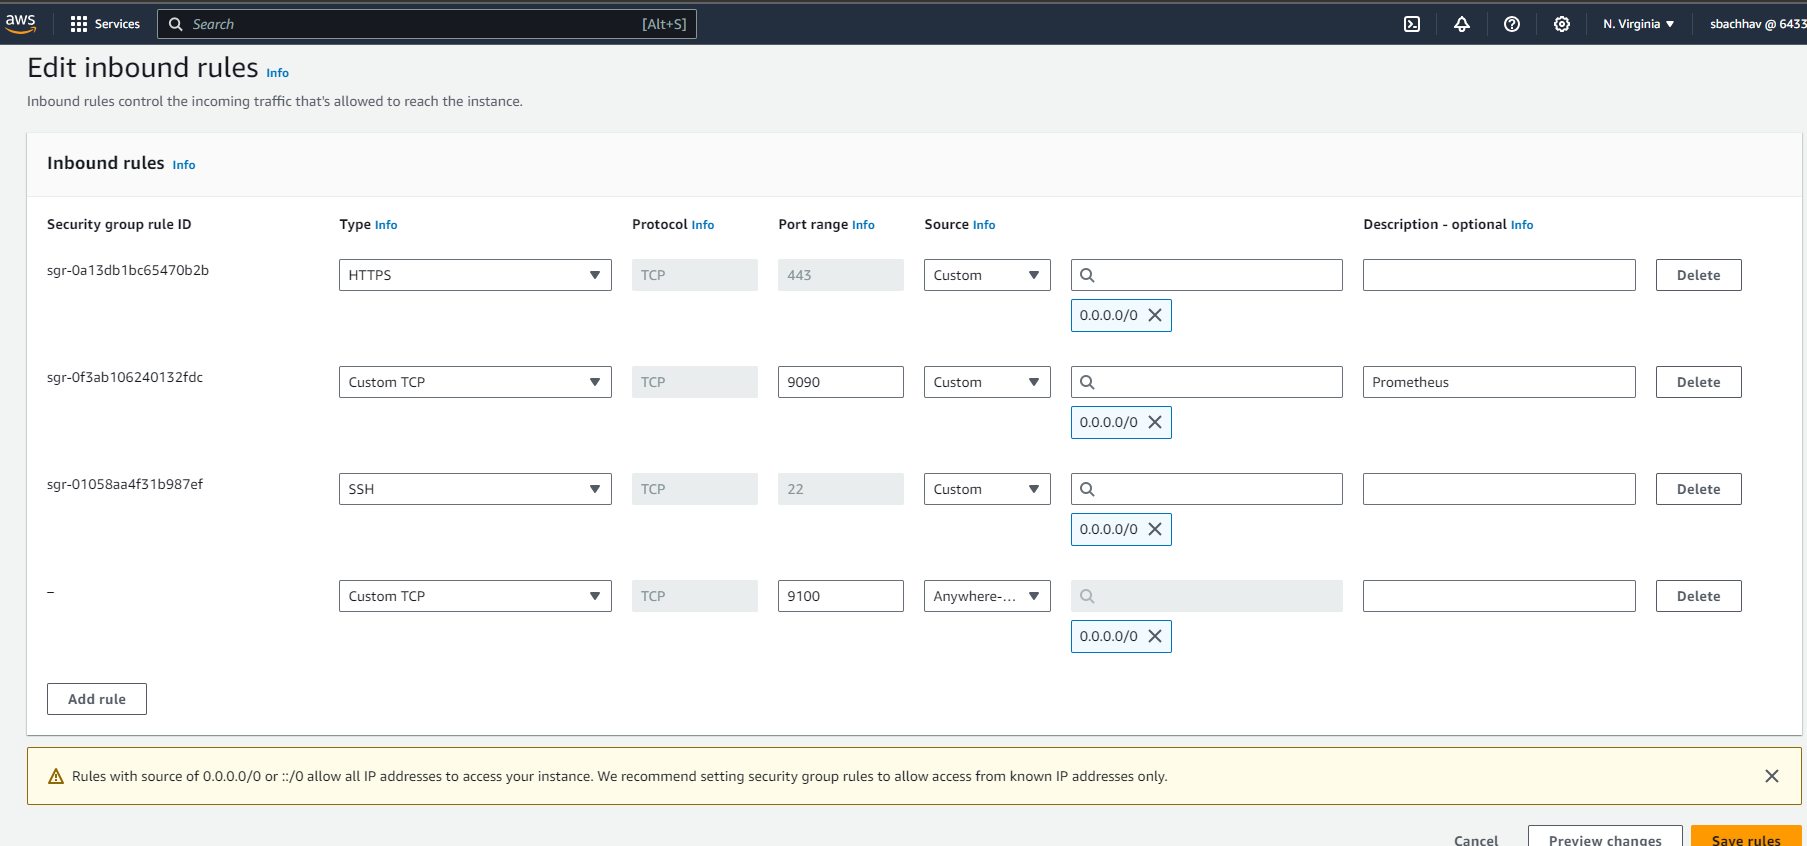
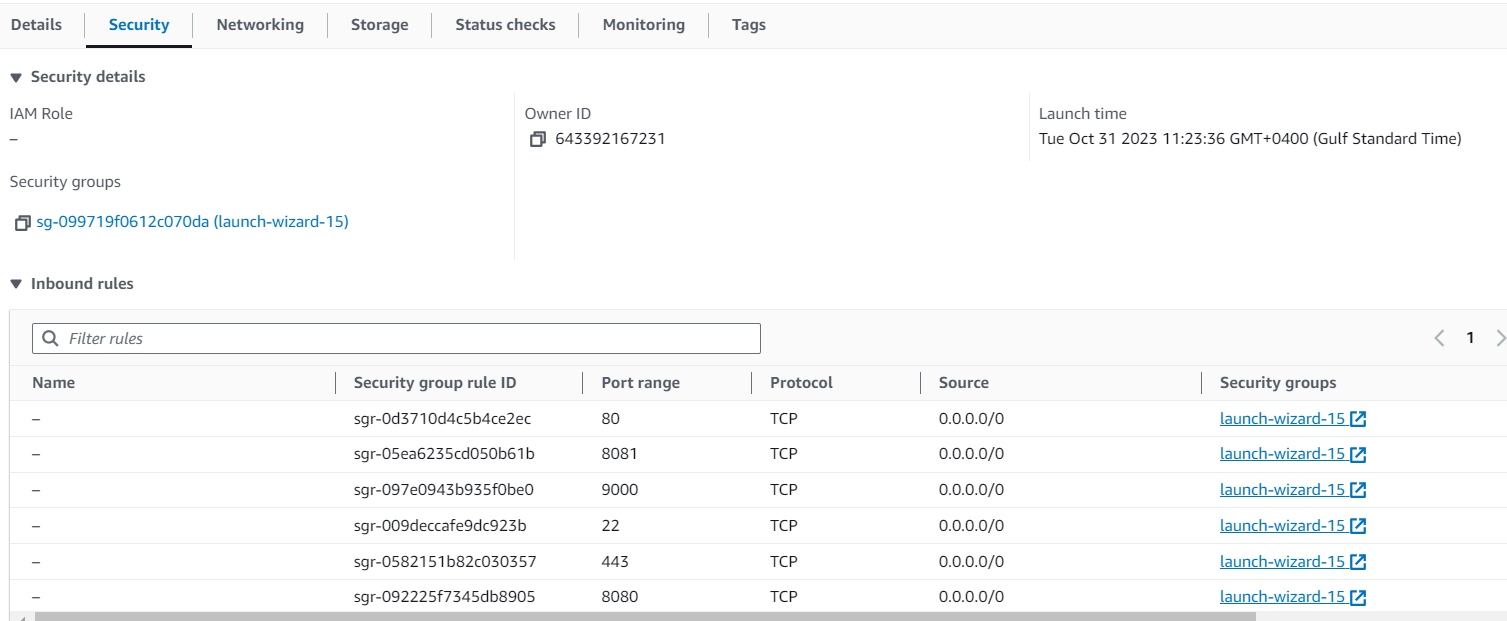
Open inbound rules for ports 9090, 9100, 8080, 8081
You can access Prometheus in a web browser using your server's IP and port 9090:
http://<your-server-ip>:9090

If you select Status ==> Targets, you will output as :

Installing Node Exporter
Next, we're going to set up and configure Node Exporter to collect Linux system metrics like CPU load and disk I/O. Node Exporter will expose these as Prometheus-style metrics
Create a system user for Node Exporter and download Node Exporter:
sudo useradd --system --no-create-home --shell /bin/false node_exporter
wget https://github.com/prometheus/node_exporter/releases/download/v1.6.1/node_exporter-1.6.1.linux-amd64.tar.gz
Extract Node Exporter files, move the binary, and clean up:
tar -xvf node_exporter-1.6.1.linux-amd64.tar.gz
sudo mv node_exporter-1.6.1.linux-amd64/node_exporter /usr/local/bin/
rm -rf node_exporter*
Create a systemd unit configuration file for Node Exporter:
sudo nano /etc/systemd/system/node_exporter.service
[Unit]
Description=Node Exporter
Wants=network-online.target
After=network-online.target

StartLimitIntervalSec=500
StartLimitBurst=5

[Service]
User=node_exporter
Group=node_exporter
Type=simple
Restart=on-failure
RestartSec=5s
ExecStart=/usr/local/bin/node_exporter --collector.logind

[Install]
WantedBy=multi-user.target
Enable and start Node Exporter:
sudo systemctl enable node_exporter
sudo systemctl start node_exporter
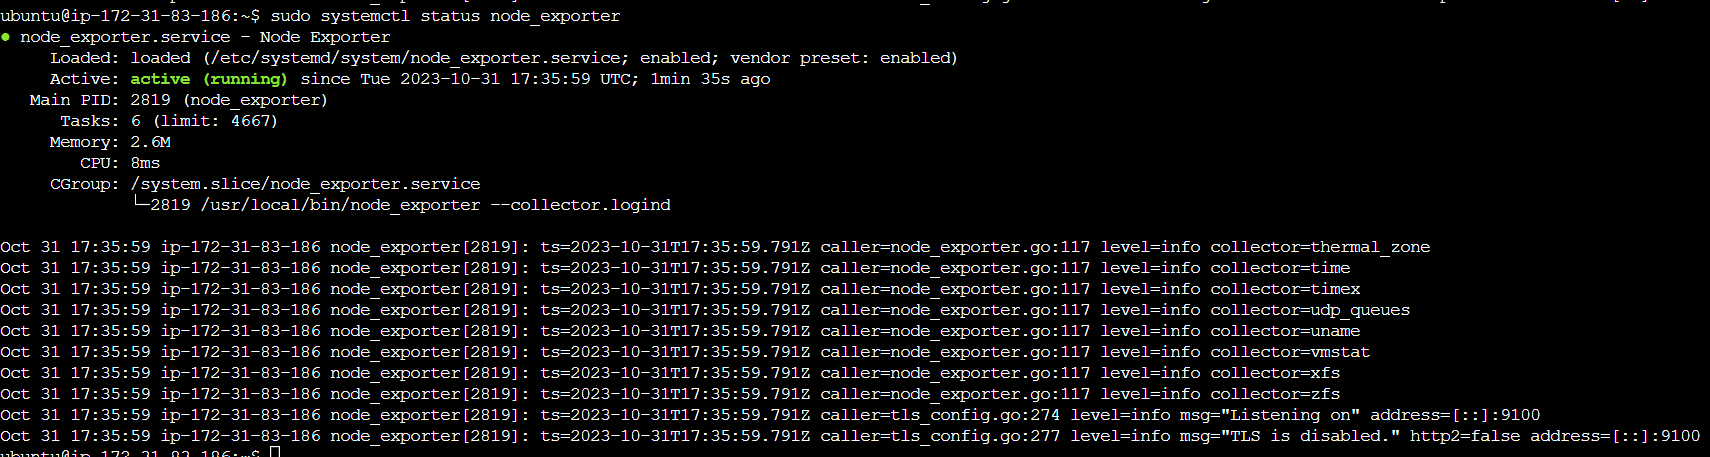
Verify the Node Exporter's status:
sudo systemctl status node_exporter
Configure Prometheus Plugin Integration:
Integrate Jenkins with Prometheus to monitor the CI/CD pipeline.
Prometheus Configuration:
To create a static target, you need to add job_name with static_configs.
To configure Prometheus to scrape metrics from Node Exporter and Jenkins, you need to modify the prometheus.yml file. Here is an example prometheus.yml configuration for your setup:
global:
  scrape_interval: 15s

scrape_configs:
  - job_name: 'node_exporter'
    static_configs:
      - targets: ['localhost:9100']

  - job_name: 'jenkins'
    metrics_path: '/prometheus'
    static_configs:
      - targets: ['<your-jenkins-ip>:<your-jenkins-port>']
Make sure to replace <your-jenkins-ip> and <your-jenkins-port> with the appropriate values for your Jenkins setup.
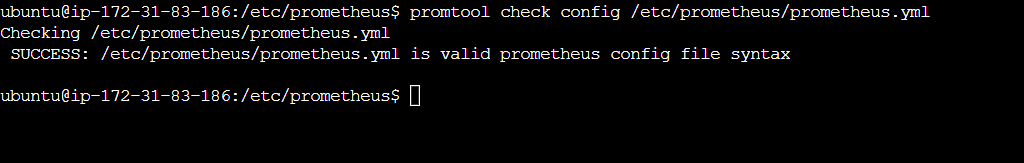
Check the validity of the configuration file:
promtool check config /etc/prometheus/prometheus.yml
Reload the Prometheus configuration without restarting:
curl -X POST http://localhost:9090/-/reload
You can access Prometheus targets at:
http://<your-prometheus-ip>:9090/targets

Phase 5 - Grafana Dashboard
Grafana complements Prometheus by providing a visualization platform to create interactive dashboards and analyze collected metrics, making it easier to monitor and troubleshoot systems.
Install Grafana
Install Grafana on the same instance where Prometheus is deployed, running Ubuntu 22.04.
To visualize metrics we can use Grafana. There are many different data sources that Grafana supports, one of them is Prometheus.
Step 1: Install Dependencies:
First, ensure that all necessary dependencies are installed:
sudo apt-get update
sudo apt-get install -y apt-transport-https software-properties-common
Step 2: Add the GPG Key:
Add the GPG key for Grafana:
wget -q -O - https://packages.grafana.com/gpg.key | sudo apt-key add -
Step 3: Add Grafana Repository:
Add the repository for Grafana stable releases:
echo "deb https://packages.grafana.com/oss/deb stable main" | sudo tee -a /etc/apt/sources.list.d/grafana.list
Step 4: Update and Install Grafana:
Update the package list and install Grafana:
sudo apt-get update
sudo apt-get -y install grafana
Step 5: Enable and Start Grafana Service:
To automatically start Grafana after a reboot, enable the service:
sudo systemctl enable grafana-server
sudo systemctl start grafana-server
Step 6: Check Grafana Status:
sudo systemctl status grafana-server

Step 7: Access Grafana Web Interface:
Open a web browser and navigate to Grafana using your server's IP address. The default port for Grafana is 3000. For example:
http://<your-server-ip>:3000
You'll be prompted to log in to Grafana. The default username is "admin," and the default password is also "admin."

Step 8: Change the Default Password:
When you log in for the first time, Grafana will prompt you to change the default password for security reasons. Follow the prompts to set a new password.
Step 9: Add Prometheus Data Source:
To visualize metrics, you need to add a data source. Follow these steps:
Select "Data Sources."
Click on the "Add data source" button.
Choose "Prometheus" as the data source type.
In the "HTTP" section:
Set the "URL" to
http://localhost:9090(assuming Prometheus is running on the same server).Click the "Save & Test" button to ensure the data source is working.
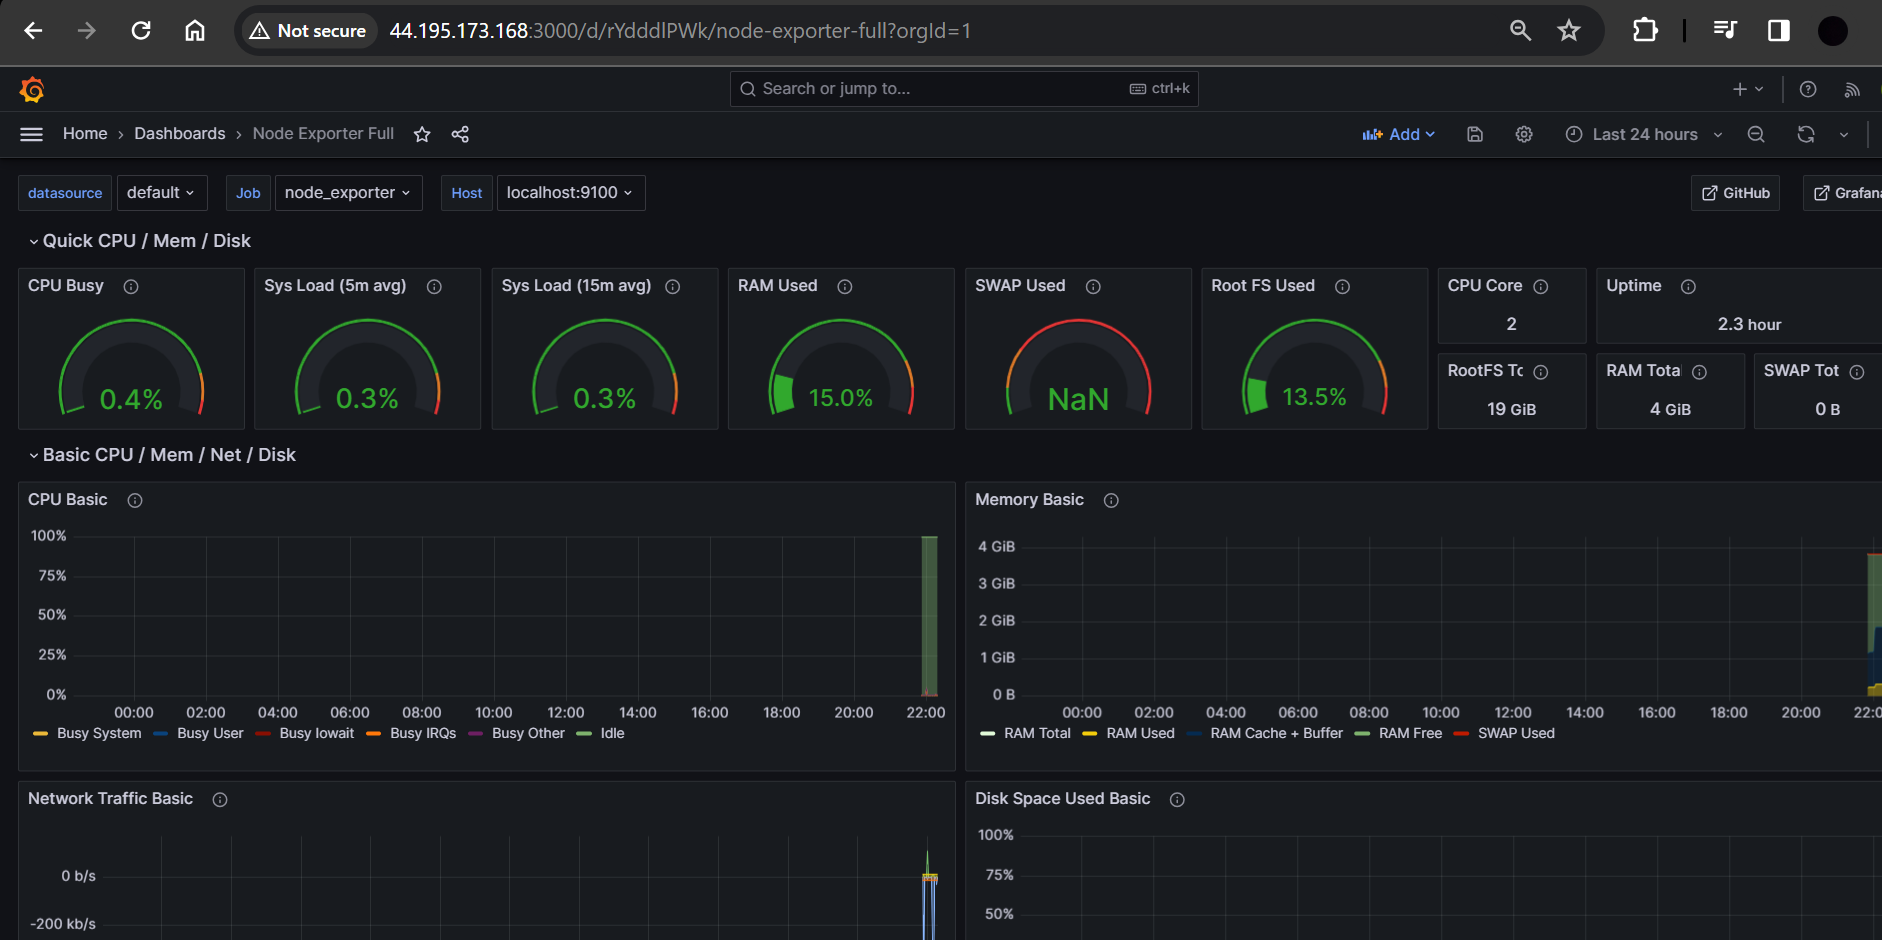
Step 10: Import a Dashboard:
To make it easier to view metrics, you can import a pre-configured dashboard. Follow these steps:
Click on the "+" (plus) icon in the left sidebar to open the "Create" menu.
Select "Dashboard."
Click on the "Import" dashboard option.
Enter the dashboard code you want to import (e.g., code 1860).
Click the "Load" button.
Select the data source you added (Prometheus) from the dropdown.
Click on the "Import" button.

You will see this output
Monitor Jenkins in the Grafana Dashboard
To set up monitoring for Jenkins. Add Prometheus plugins in Jenkins.

Restart Jenkins.

You will see Jenkins is added to it.


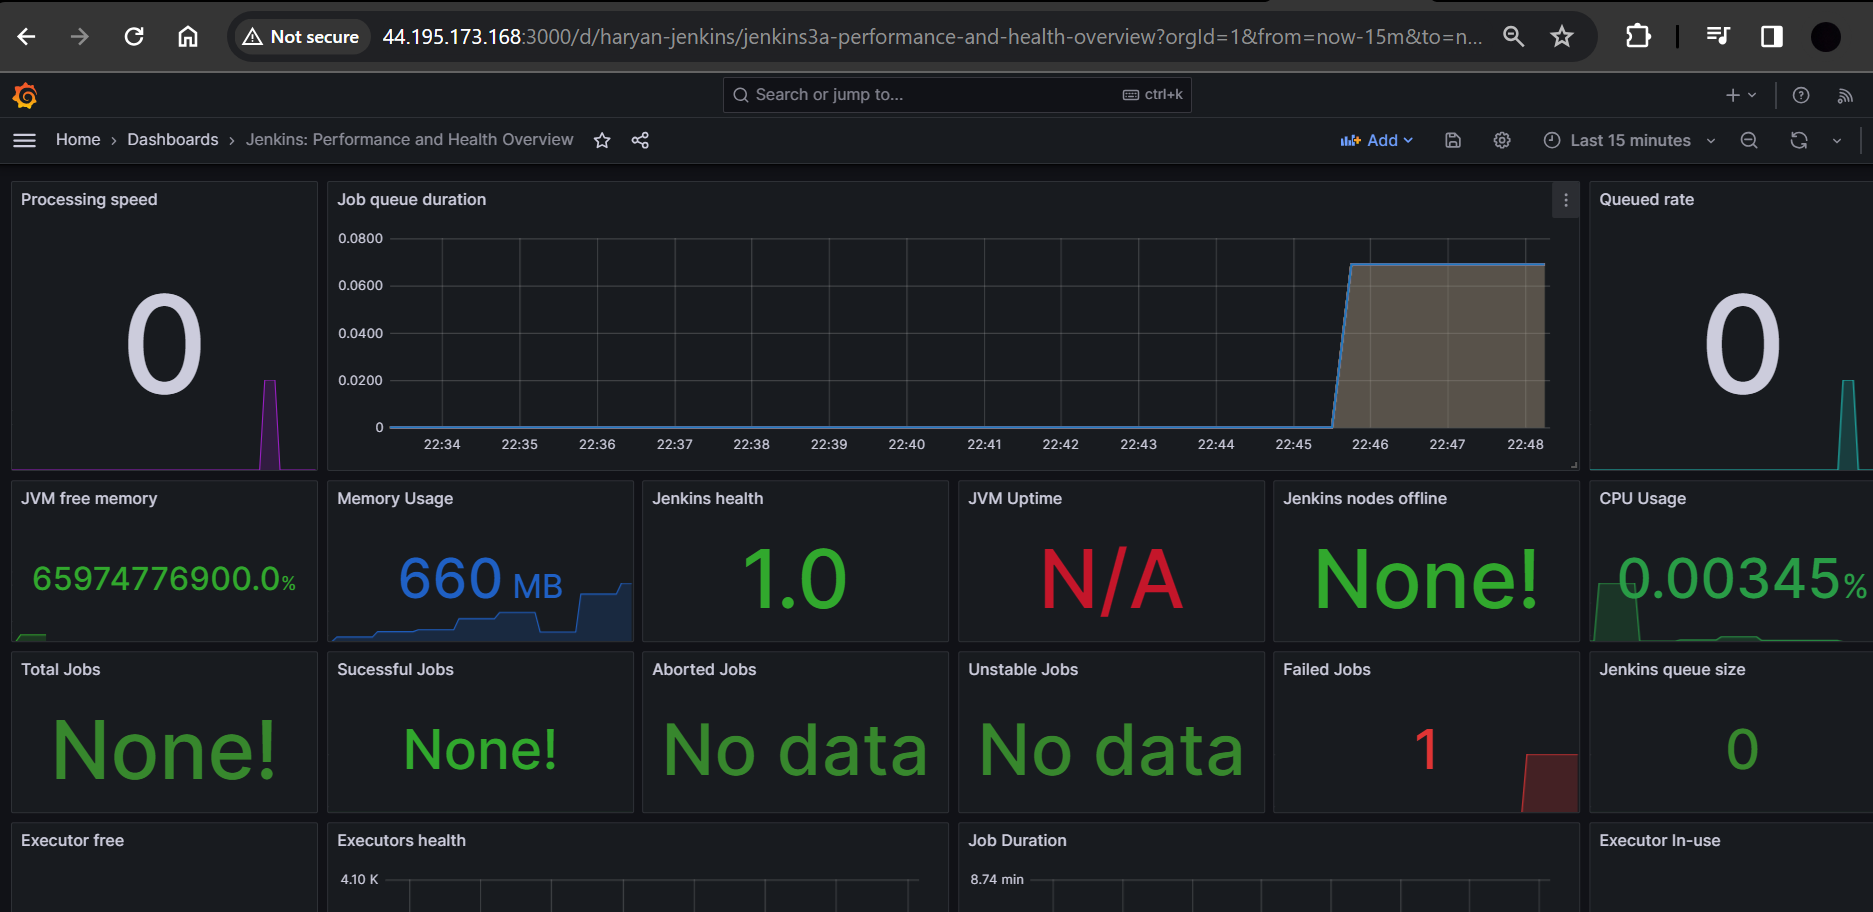
Let's add Dashboard for a better view in Grafana
Click On Dashboard --> + symbol --> Import Dashboard
Use Id 9964 and click on load
Phase 6: Kubernetes (EKS)
Do the following steps on existing EC2 Instance (netfilx-jenkins-server)
Install AWS CLI v2
Now we need to set up the AWS CLI on the EC2 machine so that we can use eksctl in the later stages
curl "https://awscli.amazonaws.com/awscli-exe-linux-x86_64.zip" -o "awscliv2.zip"
sudo apt install unzip
unzip awscliv2.zip
sudo ./aws/install -i /usr/local/aws-cli -b /usr/local/bin --update
Setup your access by
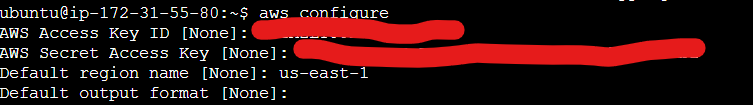
Install kubectl
Kubectl is a command-line interface (CLI) tool that is used to interact with Kubernetes clusters. It allows users to deploy, inspect, and manage Kubernetes resources such as pods, deployments, services, and more. Kubectl enables users to perform operations such as creating, updating, deleting, and scaling Kubernetes resources.
Run the following steps to install kubectl on EC2 instance.
curl -o kubectl https://amazon-eks.s3.us-west-2.amazonaws.com/1.19.6/2021-01-05/bin/linux/amd64/kubectl
chmod +x ./kubectl
sudo mv ./kubectl /usr/local/bin
kubectl version --short --client
Install eksctl
Download and extract the latest release of eksctl with the following command.
curl --silent --location "https://github.com/weaveworks/eksctl/releases/latest/download/eksctl_$(uname -s)_amd64.tar.gz" | tar xz -C /tmp
sudo mv /tmp/eksctl /usr/local/bin
eksctl version
Install helm
The next tool we need is the Helm Chart. Helm is a package manager for Kubernetes, an open-source container orchestration platform. Helm helps you manage Kubernetes applications by making it easy to install, update, and delete them.
Install Helm Chart - Use the following script to install the helm chart -
curl https://baltocdn.com/helm/signing.asc | gpg --dearmor | sudo tee /usr/share/keyrings/helm.gpg > /dev/null
sudo apt-get install apt-transport-https --yes
echo "deb [arch=$(dpkg --print-architecture) signed-by=/usr/share/keyrings/helm.gpg] https://baltocdn.com/helm/stable/debian/ all main" | sudo tee /etc/apt/sources.list.d/helm-stable-debian.list
sudo apt-get update
sudo apt-get install helm
Creating an Amazon EKS cluster using eksctl
Now in this step, we are going to create Amazon EKS cluster using eksctl
You need the following to run the eksctl command
eksctl create cluster --name eks-netflix-1 --version 1.24 --region us-east-1 --nodegroup-name worker-nodes --node-type t2.medium --nodes 1 --nodes-min 1 --nodes-max 1
aws eks update-kubeconfig --region us-east-1 --name eks-netflix-1
kubectl get nodes


It took me 20 minutes to complete this EKS cluster. If you get any error for not having sufficient data for the mentioned availability zone then try it again.
You can go back to your AWS dashboard and look for Elastic Kubernetes Service -> Clusters
Setup IAM role for service accounts
The controller runs on the worker nodes, so it needs access to the AWS ALB/NLB resources via IAM permissions. The IAM permissions can either be set up via IAM roles for ServiceAccount or can be attached directly to the worker node IAM roles.
1- Set the below values to your default AWS region, your account id and your EKS cluster name
AWS_ACCOUNT_ID=YOUR_ACCOUNT_ID_HERE
AWS_REGION=YOUR_AWS_REGION_HERE
EKS_CLUSTER_NAME=YOUR_EKS_CLUSTER_NAME_HERE
1- Create IAM OIDC provider
eksctl utils associate-iam-oidc-provider \
    --region ${AWS_REGION} \
    --cluster ${EKS_CLUSTER_NAME} \
    --approve
2- Download IAM policy for the AWS Load Balancer Controller
curl -fsSL -o iam-policy.json https://raw.githubusercontent.com/kubernetes-sigs/aws-load-balancer-controller/v2.4.0/docs/install/iam_policy.json
3- Create a IAM role and ServiceAccount for the AWS Load Balancer controller using eksctl tool
eksctl create iamserviceaccount \
    --cluster=${EKS_CLUSTER_NAME} \
    --namespace=kube-system \
    --name=aws-load-balancer-controller \
    --attach-policy-arn=arn:aws:iam::${AWS_ACCOUNT_ID}:policy/AWSLoadBalancerControllerIAMPolicy \
    --override-existing-serviceaccounts \
    --approve \
    --region ${AWS_REGION}
4- Install the helm chart by specifying the chart values serviceAccount.create=false and serviceAccount.name=aws-load-balancer-controller
helm repo add eks https://aws.github.io/eks-charts

helm install aws-load-balancer-controller eks/aws-load-balancer-controller \
    -n kube-system \
    --set clusterName=${EKS_CLUSTER_NAME} \
    --set serviceAccount.create=false \
    --set serviceAccount.name=aws-load-balancer-controller
Install Argocd
ArgoCD is a widely-used GitOps continuous delivery tool that automates application deployment and management on Kubernetes clusters, leveraging Git repositories as the source of truth. It offers a web-based UI and a CLI for managing deployments, and it integrates with other tools. ArgoCD streamlines the deployment process on Kubernetes clusters and is a popular tool in the Kubernetes ecosystem.
kubectl create namespace argocd
kubectl apply -n argocd -f https://raw.githubusercontent.com/argoproj/argo-cd/v2.4.7/manifests/install.yaml
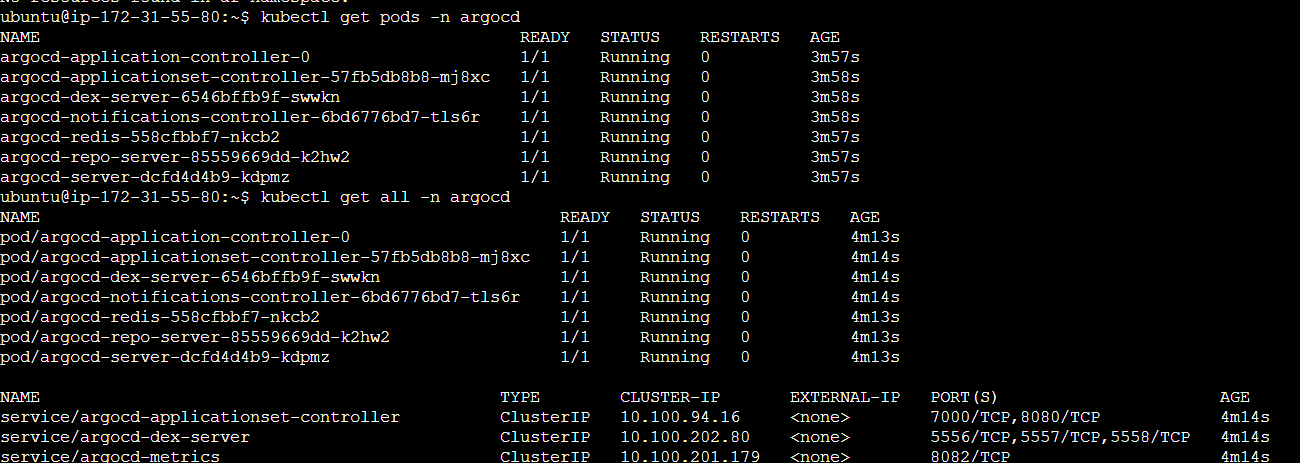
kubectl patch svc argocd-server -n argocd -p '{"spec": {"type": "LoadBalancer"}}'
Install Node Exporter using Helm
To begin monitoring your Kubernetes cluster, you'll install the Prometheus Node Exporter. This component allows you to collect system-level metrics from your cluster nodes. Here are the steps to install the Node Exporter using Helm:
- Add the Prometheus Community Helm repository:
helm repo add prometheus-community https://prometheus-community.github.io/helm-charts
Create a Kubernetes namespace for the Node Exporter:
kubectl create namespace prometheus-node-exporter
Install the Node Exporter using Helm:
helm install prometheus-node-exporter prometheus-community/prometheus-node-exporter --namespace prometheus-node-exporter

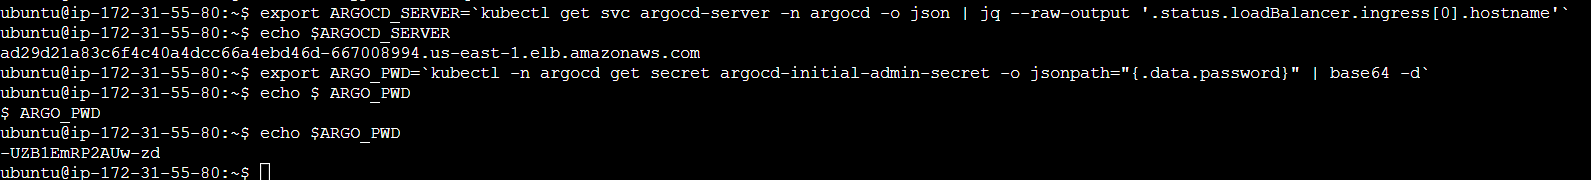
export ARGOCD_SERVER=`kubectl get svc argocd-server -n argocd -o json | jq --raw-output '.status.loadBalancer.ingress[0].hostname'`
echo $ARGOCD_SERVER
export ARGO_PWD=`kubectl -n argocd get secret argocd-initial-admin-secret -o jsonpath="{.data.password}" | base64 -d`
echo $ARGO_PWD
Take the LoadBalancer link and open it in your browser. Click on Advanced ==> then click on the bottom link.

After installing ArgoCD, you need to set up your GitHub repository as a source for your application deployment. This typically involves configuring the connection to your repository and defining the source for your ArgoCD application. The specific steps will depend on your setup and requirements.

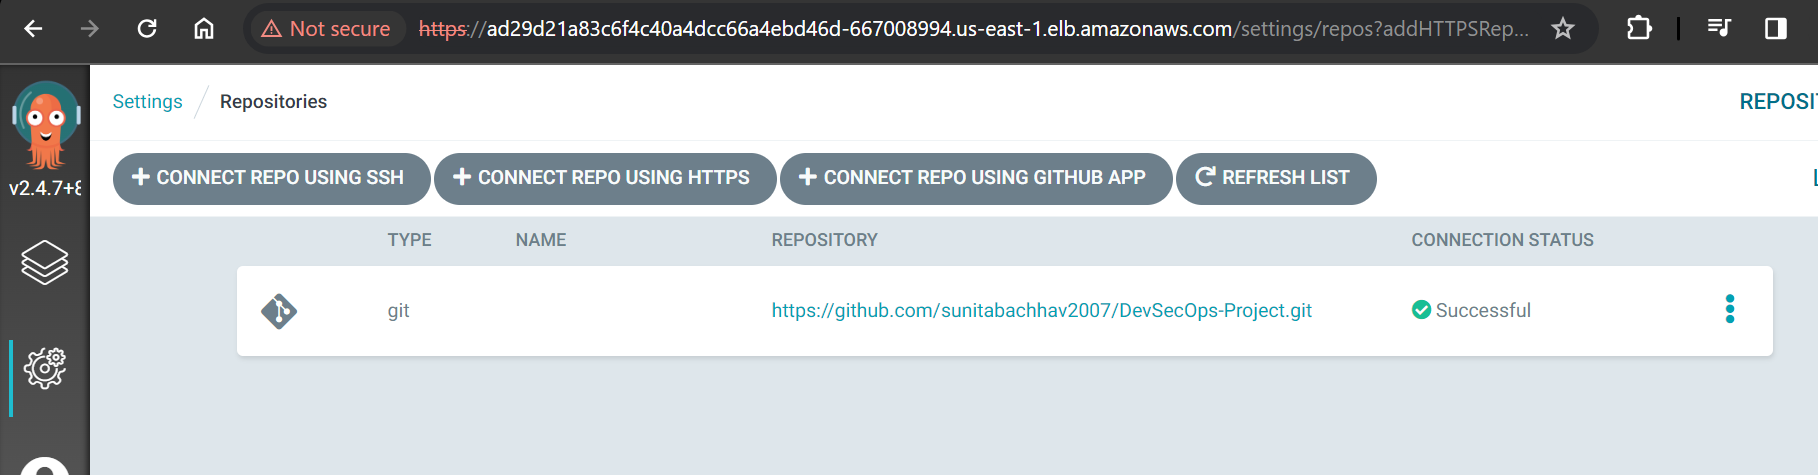

You have now successfully deployed an application using Argo CD.
Argo CD is a Kubernetes controller, responsible for continuously monitoring all running applications and comparing their live state to the desired state specified in the Git repository.

Access your Application
Open inbound traffic on port 30007 and 9100 for EKS cluster node IP.
To Access the app make sure port 30007 is open in your security group and then open a new tab paste your NodeIP:30007, your app should be running.


Add a Job to Scrape Metrics on nodeip:9100/metrics in prometheus.yml:
Update your Prometheus configuration (prometheus.yml) to add a new job for scraping metrics from nodeip:9100/metrics. You can do this by adding the following configuration to your prometheus.yml file:
  - job_name: 'Netflix'
    metrics_path: '/metrics'
    static_configs:
      - targets: ['node1Ip:9100']

Replace 'your-job-name' with a descriptive name for your job. The static_configs section specifies the targets to scrape metrics from, and in this case, it's set to nodeip:9100.
Don't forget to reload or restart Prometheus to apply these changes to your configuration.
References
Github: https://github.com/sunitabachhav2007/DevSecOps-Project.git
Youtube Link: https://www.youtube.com/watch?v=g8X5AoqCJHc&t=7s
Clean UP
In this stage, you're going to clean up and remove all resources that we created during the session. So that it will not be charged to you afterward.
Use the provided command to remove the EKS cluster.
eksctl delete cluster --name eks-netflix-1
Terminate EC2 Instances (Jenkins and monitoring)
Thank you
Through this exercise, you will acquire a thorough grasp of an extensive CI/CD pipeline that incorporates multiple tools, including GitHub, Docker, DockerHub, Trivy, OWASP, and SonarQube. Additionally, it leverages ArgoCD and Kubernetes to facilitate continuous delivery (CD), while underscoring the significance of vigilant performance monitoring using Prometheus and Grafana for your application.
Thanks for reading to the end; I hope you gained some knowledge.